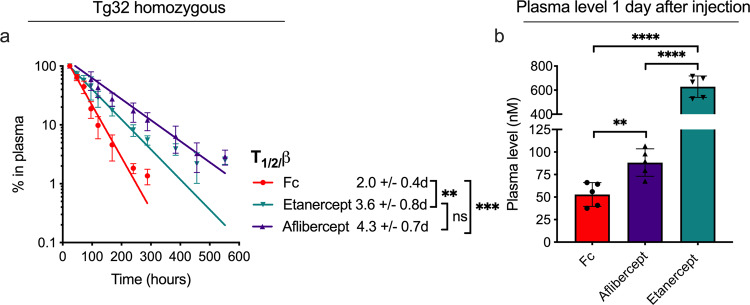
Fig. 2. Circulatory properties of IgG1 Fc and Fc-fusions in hFcRn transgenic mice.
a Elimination curves and estimated β-phase half-life of the IgG1 Fc fragment (shown in red), aflibercept (shown in dark purple) and etanercept (shown in teal) in homozygous Tg32 mice. b Molar amounts at the start of the β-phase (1 day after IV injection). n = 5 individual mice per group. **p < 0.005, ***p < 0.0005, ****p < 0.0001 (two-tailed, unpaired Student’s t test). Data show mean values ± SD.

