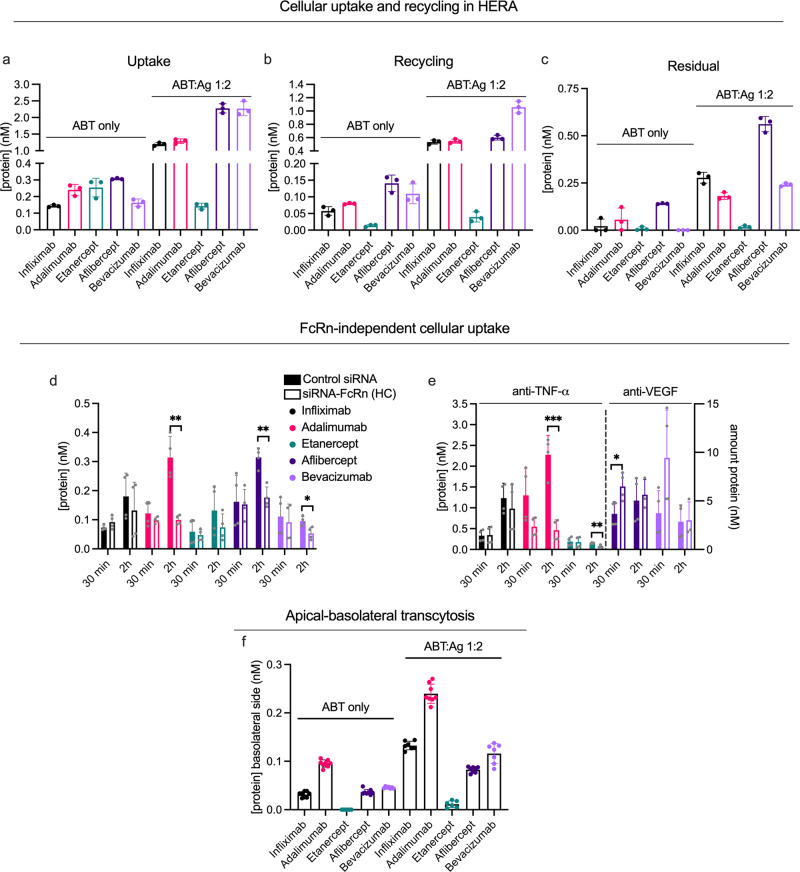
Fig. 6. FcRn-mediated cellular handling differs between ABTs with distinct Fc-fused modalities.
a, c, e HERA parameters from one representative experiment, assessing amounts of ABTs as monomers (ABT only) and preincubated with a two-fold molar excess of their cognate Ags at pH 7.4 (ABT:Ag 1:2) taken up (a), recycled by (b) and kept in (c) HMEC-1-FcRn cells (n = 3 per bar). Two representative experiments showing amount of ABTs, as both monomers (d) and after preincubation with two-fold molar excess of cognate Ags (e), taken up after incubation for 30 min or 2 h on HMEC-1-FcRn cells treated with control siRNA or siRNA against the HC of FcRn. In e, anti-TNF-α and anti-VEGF ABTs are plotted on the left and right y-axis, respectively, as indicated. Differences between ctrl and siRNA-FcRn-treated cells for each sample group are indicated (*p < 0.05, **p < 0.005, ***p < 0.0005, two-tailed, unpaired Student’s t test). n = 4 per bar. f Amount of monomeric and Ag-bound ABTs on the basolateral side of polarized MDCK-hFcRn cells following apical application and an incubation of 4 h. Values correspond to two independent experiments (n = 8 per bar). Color labeling; infliximab (black), adalimumab (pink), etanercept (teal), aflibercept (dark purple), bevacizumab (light purple). Data show mean values ± SD.

