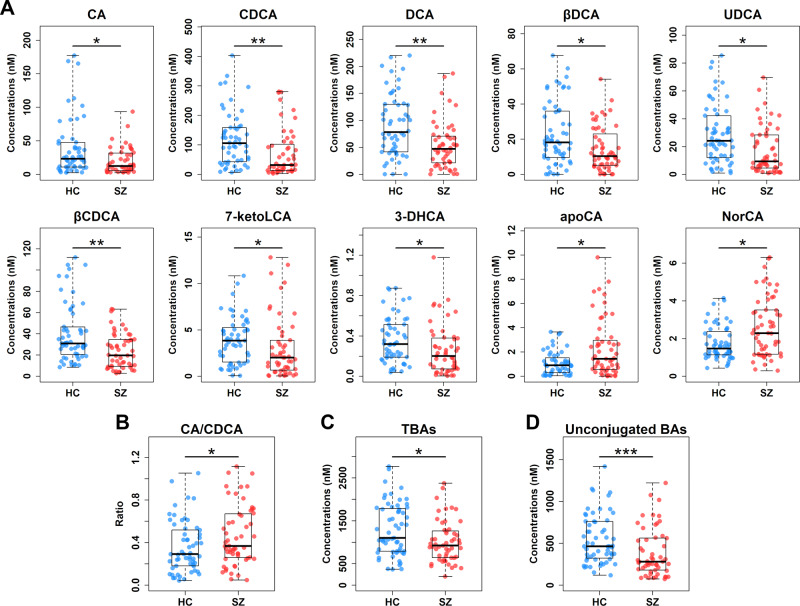
Fig. 2. Serum BA profile is significantly altered in SZ.
A Scatter box plots for 10 significantly differential BAs in the discovery set. The comparisons between the two groups were conducted by the Mann–Whitney U tests, excluding outliers and correcting with FDR. *q < 0.05; **q < 0.01. Scatter box plots for the ratio of CA to CDCA (B), total BAs (TBAs) (C), and total unconjugated BAs (D). The comparisons between the two groups were conducted by the Mann–Whitney U tests, excluding outliers. *p < 0.05; ***p < 0.001. Center lines of box plots show median values, box hinges indicate 1st and 3rd quartiles, and whisker represent the furthest data points within 1.5 interquartile ranges of the hinges.

