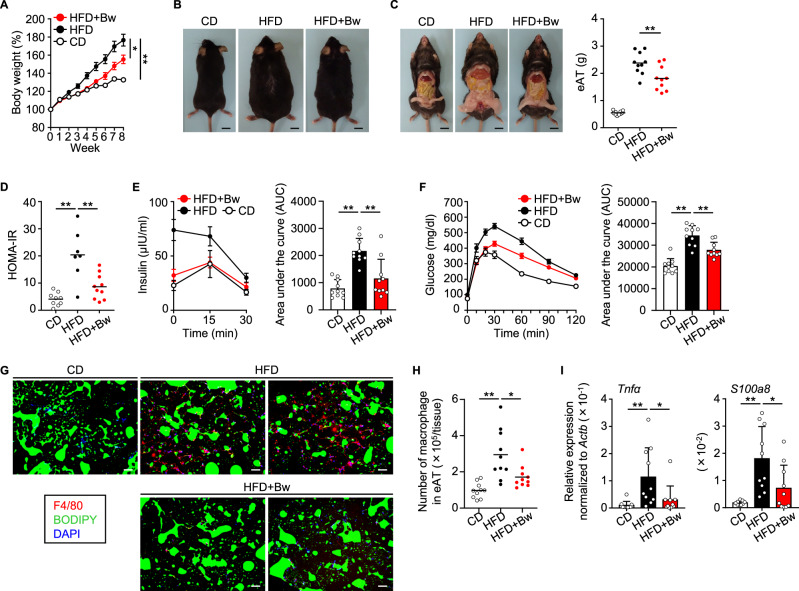
Fig. 2. High-fat diet (HFD)-induced obesity and diabetes were ameliorated by oral administration of Blautia wexlerae to mice.
A Mice were maintained on standard chow (control diet, CD) or HFD without or with oral administration of B. wexlerae (Bw) three times each week and were weighed weekly. Data are representative of at least three independent experiments (n = 5, mean ± 1 SD). *P = 0.0105; **P = 0.0005 (two-way ANOVA). B Photographs of representative mice. C Photographs of representative mice and weight of epididymal adipose tissue (eAT). Data are combined from two independent experiments (n = 10, mean). **P = 0.0039 (one-way ANOVA). D HOMA-IR, an indicator of insulin resistance, calculated as ‘glucose (mg/dl) × insulin (µU/ml)/405’. Data are combined from two independent experiments without hemolytic samples (n = 7–10, mean). **P < 0.01 (one-way ANOVA). E Blood insulin was monitored through intraperitoneal glucose tolerance testing (IPGTT). Data are combined from two independent experiments (n = 10, mean ± 1 SD). **P < 0.01 (one-way ANOVA). F Blood glucose was monitored by using IPGTT. Data are combined from two independent experiments (n = 10, mean ± 1 SD). **P < 0.01 (one-way ANOVA). G Representative immunohistologic analysis of eAT. Macrophages, lipid droplets, and nuclei were visualized by using F4/80 monoclonal antibody (red), BODIPY (green), and DAPI (blue) staining, respectively. Scale bar, 100 µm. H Number of macrophages in the eAT. Data are combined from two independent experiments (n = 10, mean). *P = 0.0140; **P = 0.0001 (one-way ANOVA). I Gene expression of Tnfα, an inflammatory cytokine, and S100a8, a chemokine for recruiting macrophages, in the eAT mature adipocyte fraction (MAF). Data are combined from two independent experiments (n = 10, mean ± 1 SD). *P < 0.05; **P < 0.01 (one-way ANOVA). CD, lean mice fed a standard chow diet (CD-fed mice); HFD, obese mice fed a high-fat diet (HFD-fed mice); HFD + Bw, HFD-fed mice orally supplemented with B. wexlerae.

