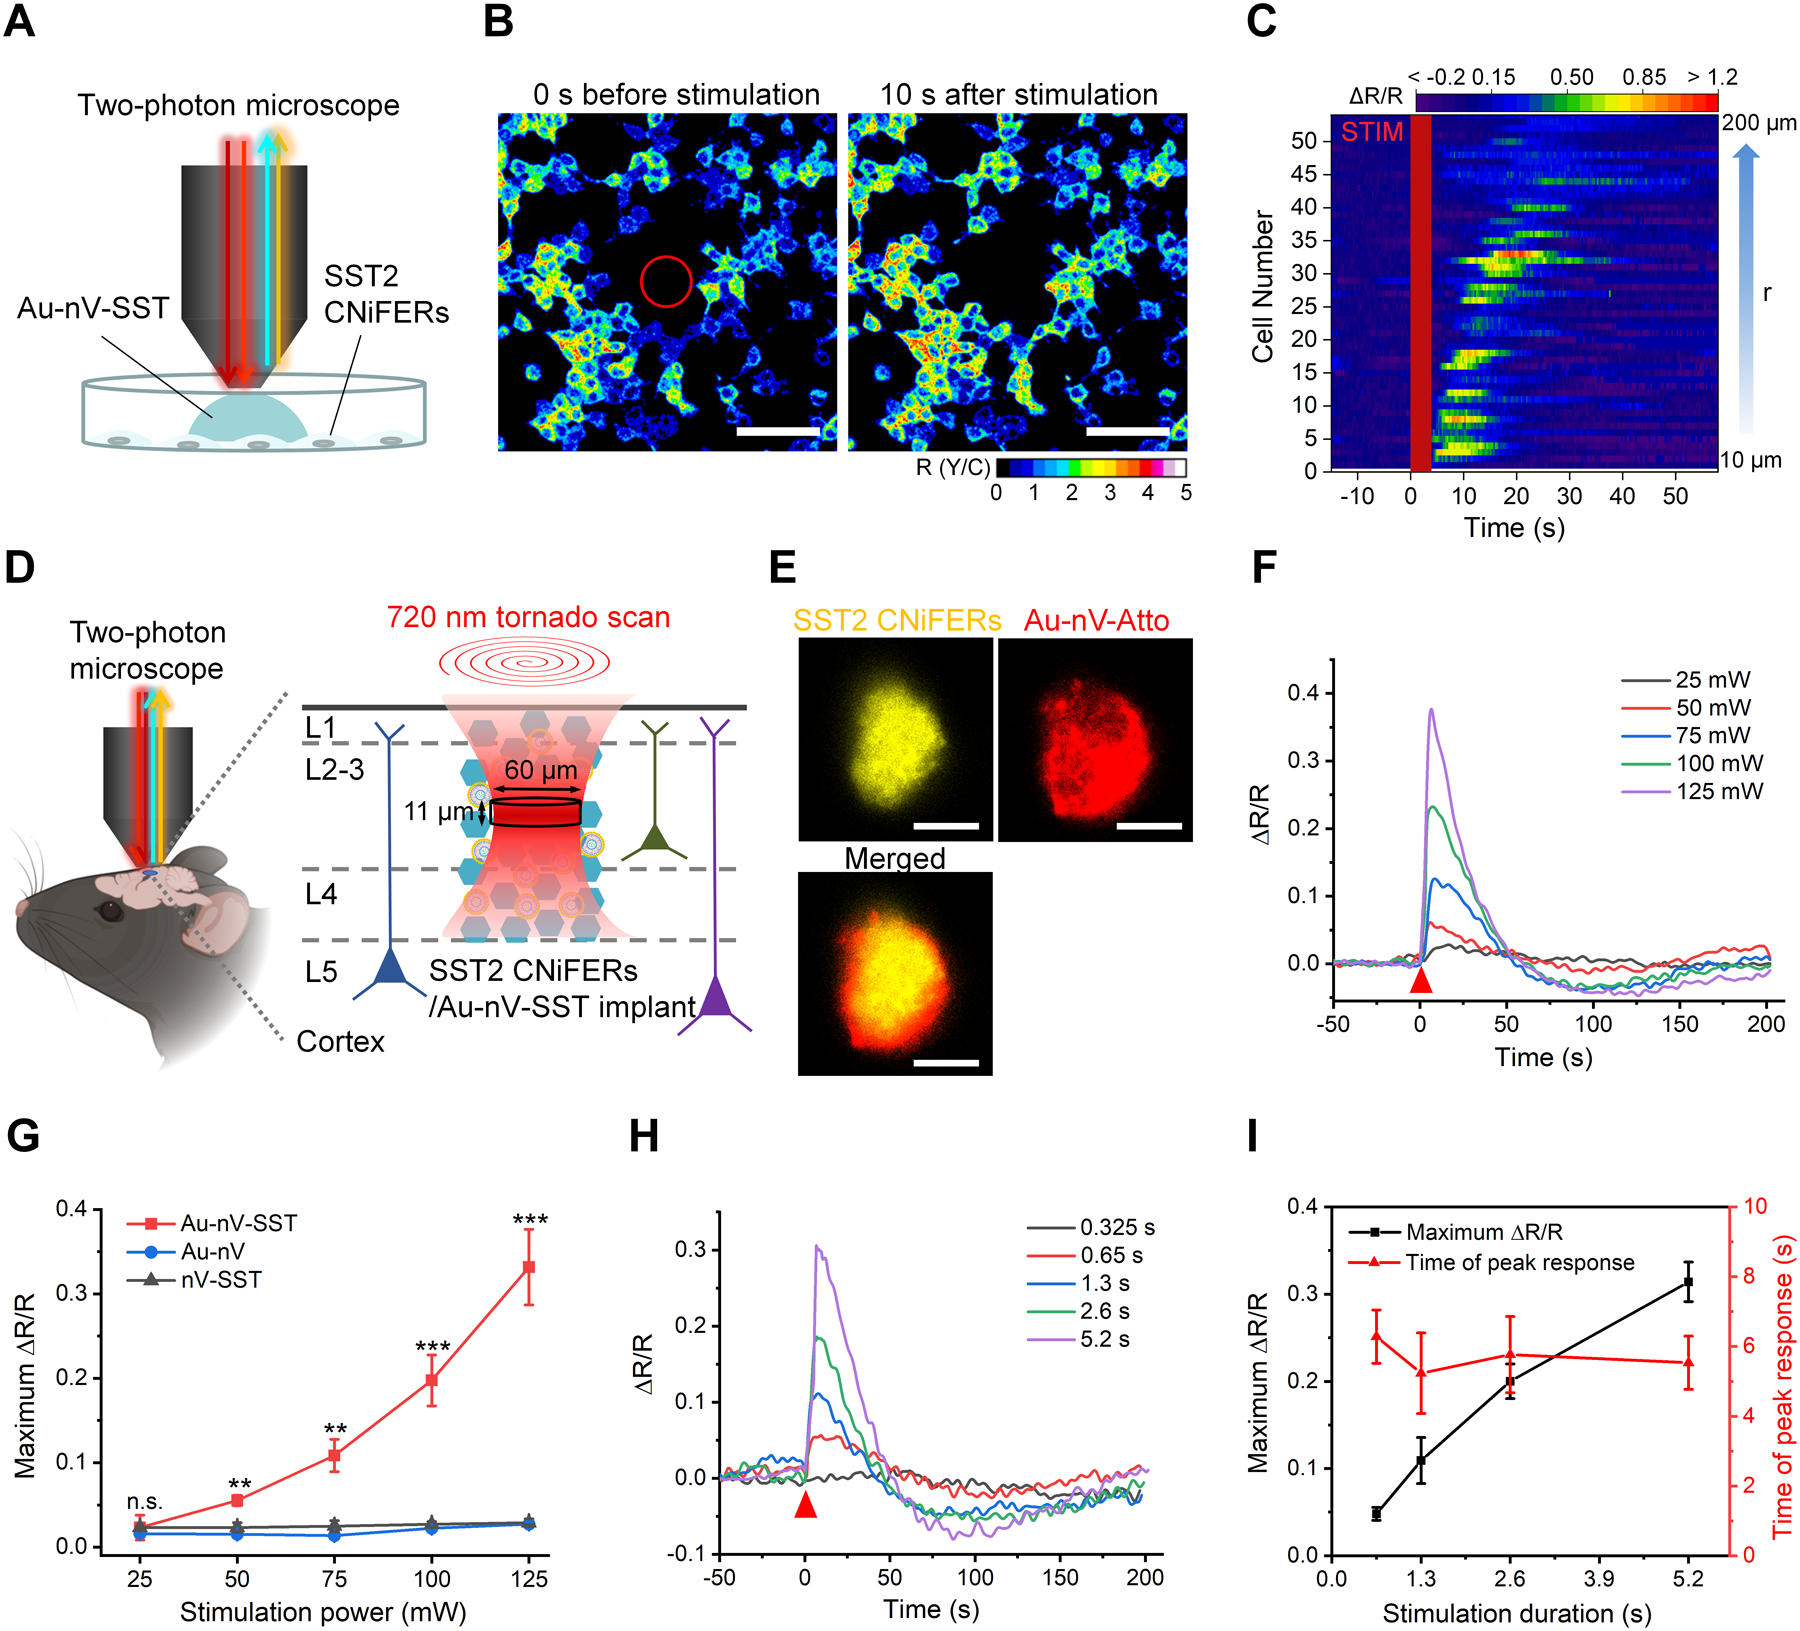
Figure 2.

Real-time photorelease and monitoring of SST. A) Schematic of photoreleasing and monitoring SST on cultured SST2 CNiFERs with a two-photon microscope. B) Representative images of the ratio of YFP and CFP (R(Y/C)) of SST2 CNiFERs before and after laser stimulation on Au-nV-SST (720 nm, 300 mW, 4 s). Tornado scans with a diameter of 60 μm were performed in the center (marked as a red circle) at 0 s. Scale bar: 100 μm. C) Heat map of FRET response (ΔR/R) for activated CNiFERs. STIM represents the photo-stimulation at 0 s. Cell number was sorted by the distance (r) from the center. D) Schematic of implantation of co-mingled SST2 CNiFERs/Au-nV-SST mixture into mouse cortex. Au-nV-SST was stimulated by tornado scans (diameter: 60 μm) at 720 nm with an axial resolution of 11 μm. E) Representative two-photon fluorescent images of SST2 CNiFERs (Ex: 900 nm; Em: 520–560 nm) and Atto 647N-labeled Au-nV (Ex: 1100 nm; Em: 575–645 nm) at the depth of 200 μm in mouse cortex. Scale bar: 50 μm. F, G) FRET change (ΔR/R) trace (F) and maximum ΔR/R (G) of the SST2 CNiFERs implant under 720 nm laser stimulation with different laser power (2.6 s, n = 3 implants from 3 mice per group). The red triangle indicates the photo-stimulation at 0 s. Au-nV: gold-coated empty nanovesicles. nV-SST: SST-loaded nanovesicles without gold coating. Statistical analysis was conducted by a two-sample Student’s t-test between the Au-nV-SST and control groups (Au-nV, nV-SST). H) FRET change (ΔR/R) for SST2 CNiFERs implants plotted for different scan durations with 720 nm laser stimulation (100 mW). I) The maximum ΔR/R and time of peak response are plotted as a function of stimulation duration (n = 3 implants from 3 mice). No significant differences were found between the two times of peak response at different scan numbers by a two-sample Student’s t-test. Data are expressed as Mean ± S.D.; **p < 0.01; ***p < 0.001; n.s., not significantly different.
