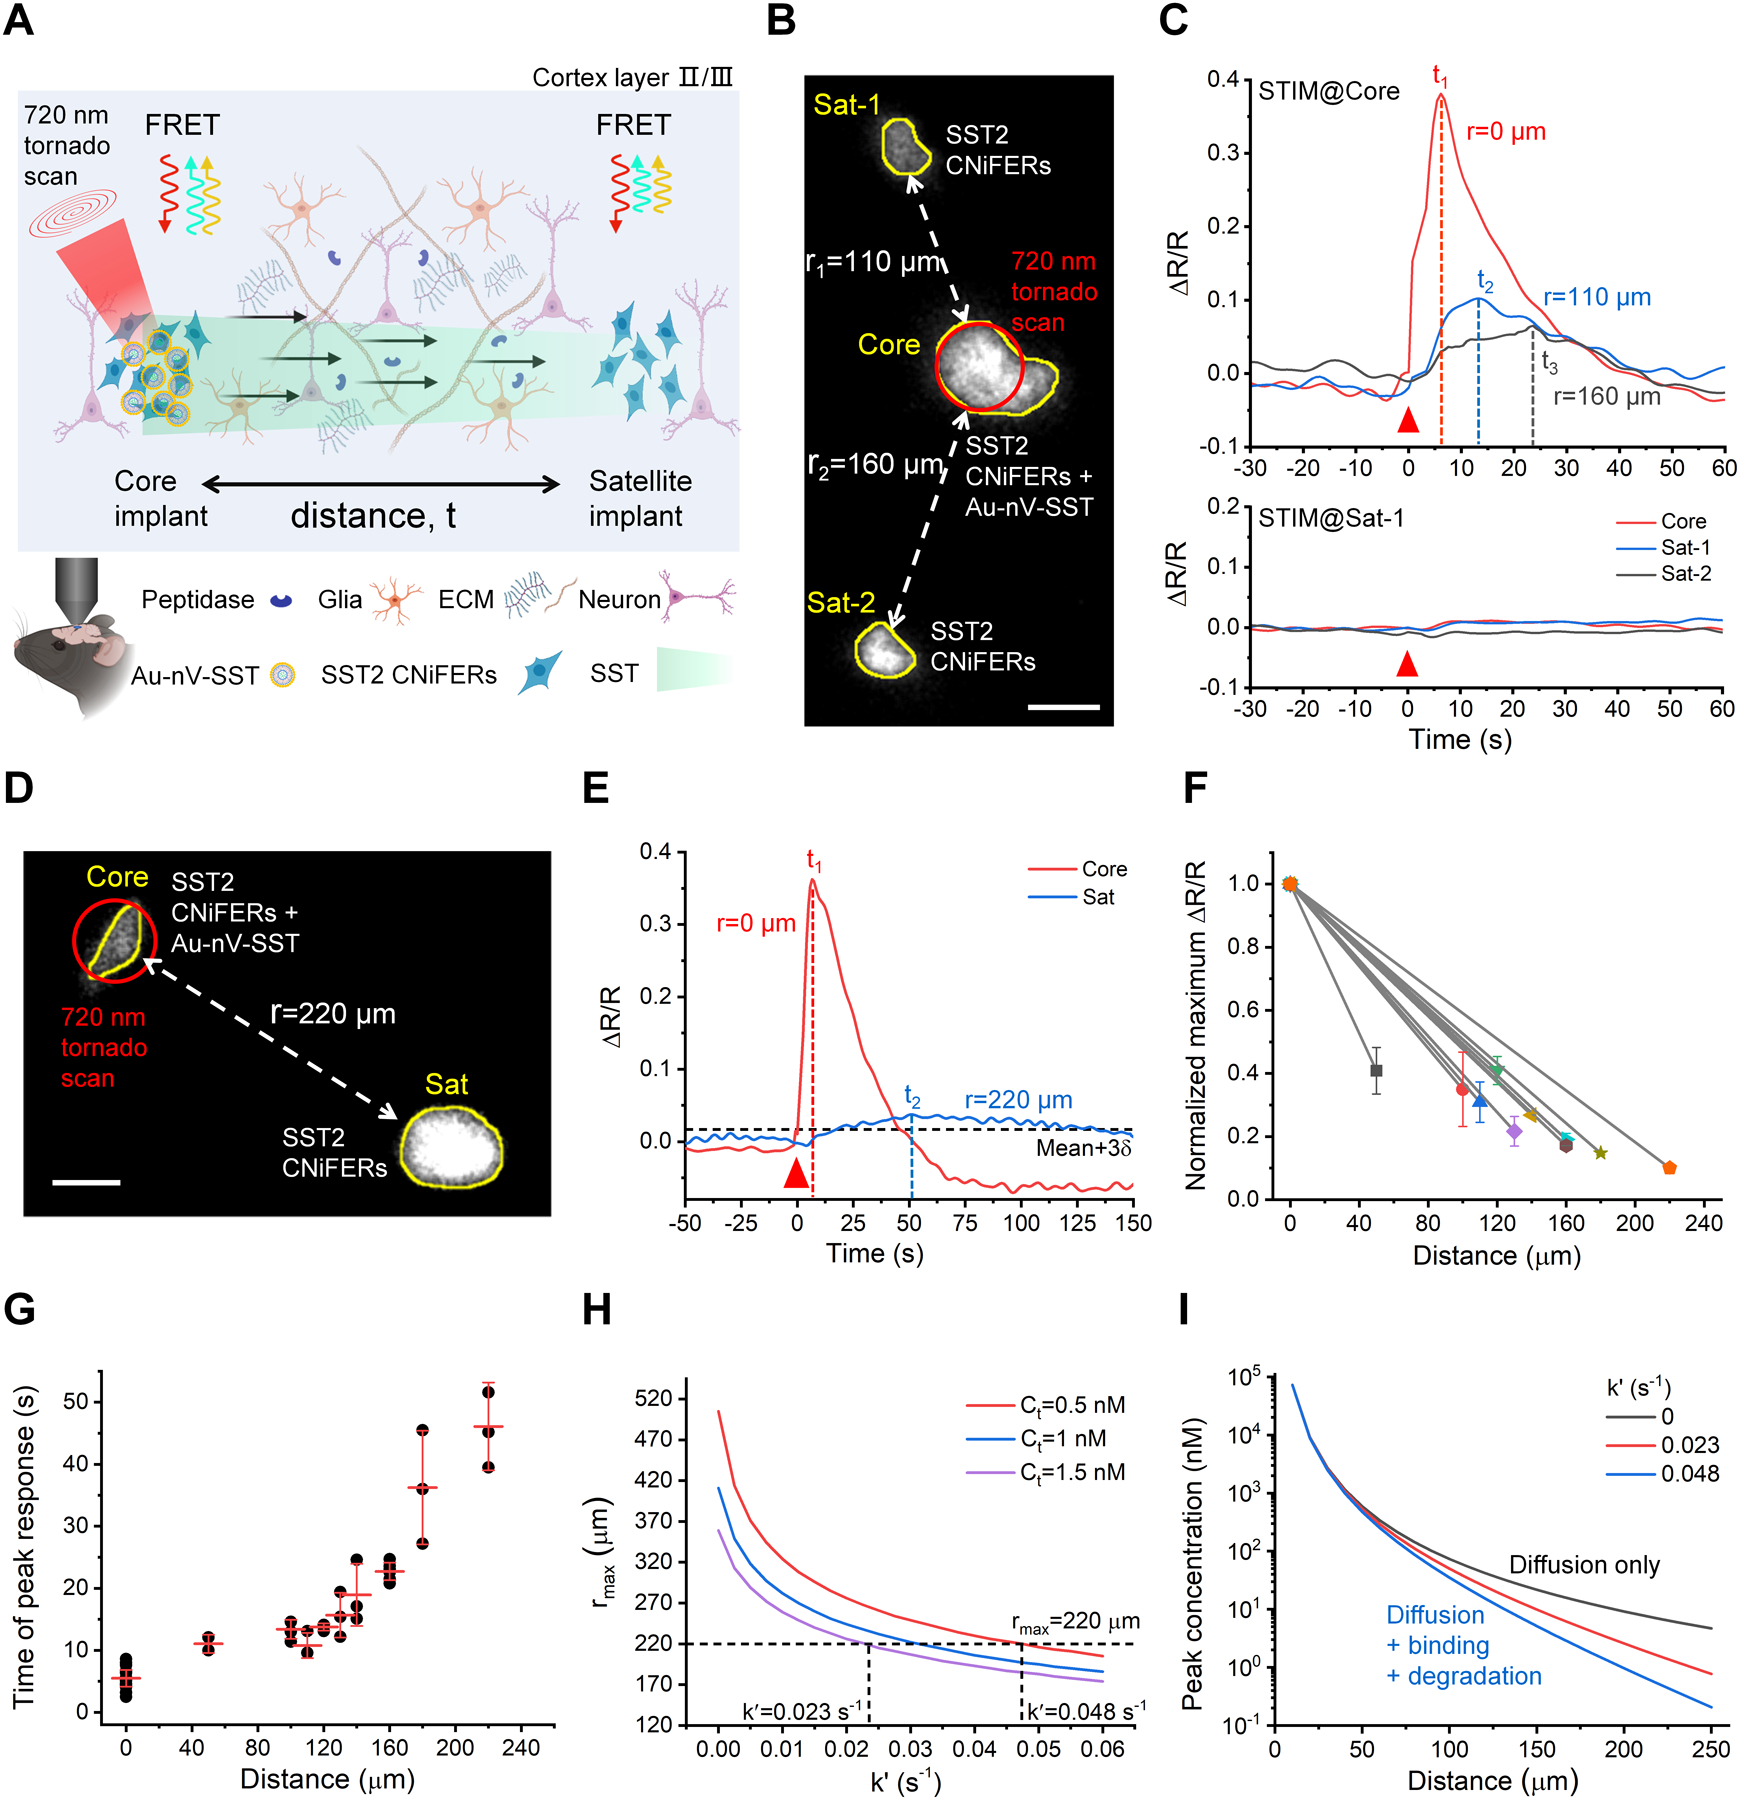
Figure 3.

Measurement of SST volume transmission in vivo. A) Schematic of SST transmission measurement by implanting two clusters of SST2 CNiFERs, in which the core implant (left) is mixed with Au-nV-SST. B) Two-photon fluorescent image of SST2 CNiFERs at a depth of 200 μm in mouse cortex (Ex: 900 nm; Em: 520–560 nm). The implant in the center (Core) was mixed with Au-nV-SST, while the other two satellite implants (Sat-1, Sat-2) were SST2 CNiFERs alone. Scale bar: 50 μm. C) The response curves of SST2 CNiFERs when stimulating (STIM) at different regions (720 nm, 100 mW, 2.6 s). The red triangle indicates the photo-stimulation at 0 s. D) Two-photon fluorescent image of SST2 CNiFER clusters at a distance of 220 μm in mouse cortex. Scale bar: 50 μm. E) The response curves of SST2 CNiFERs when stimulating at the core implant (Core). The threshold of the valid signal is set as Mean + 3δ (δ: the standard deviation of baseline). F) Normalized maximum ΔR/R of paired SST2 CNiFERs implants at different distances in untreated mice brains (n = 10 pairs of implants in 9 mice, 2–4 repeated measurements for a pair of implants). G) Time of peak response from SST2 CNiFER implants at defined distances in untreated mice brains. Photo-stimulation is at 0 s. The centerline represents the mean value. H) Predicted maximal diffusion distance (rmax) as a function of loss rate (k′) from point-source diffusion model (Equation 2) with total SST released number Q = 1.2 × 10⁸ and effective diffusion coefficient D* = 8.9 × 10⁻⁷ cm2•s−1 (from optical integrative imaging measurement). The horizontal dashed line represents the experimental rmax = 220 μm. I) Predicted concentration as a function of distance from Equation 2. Data are expressed as Mean ± S.D.
