
Figure 4.
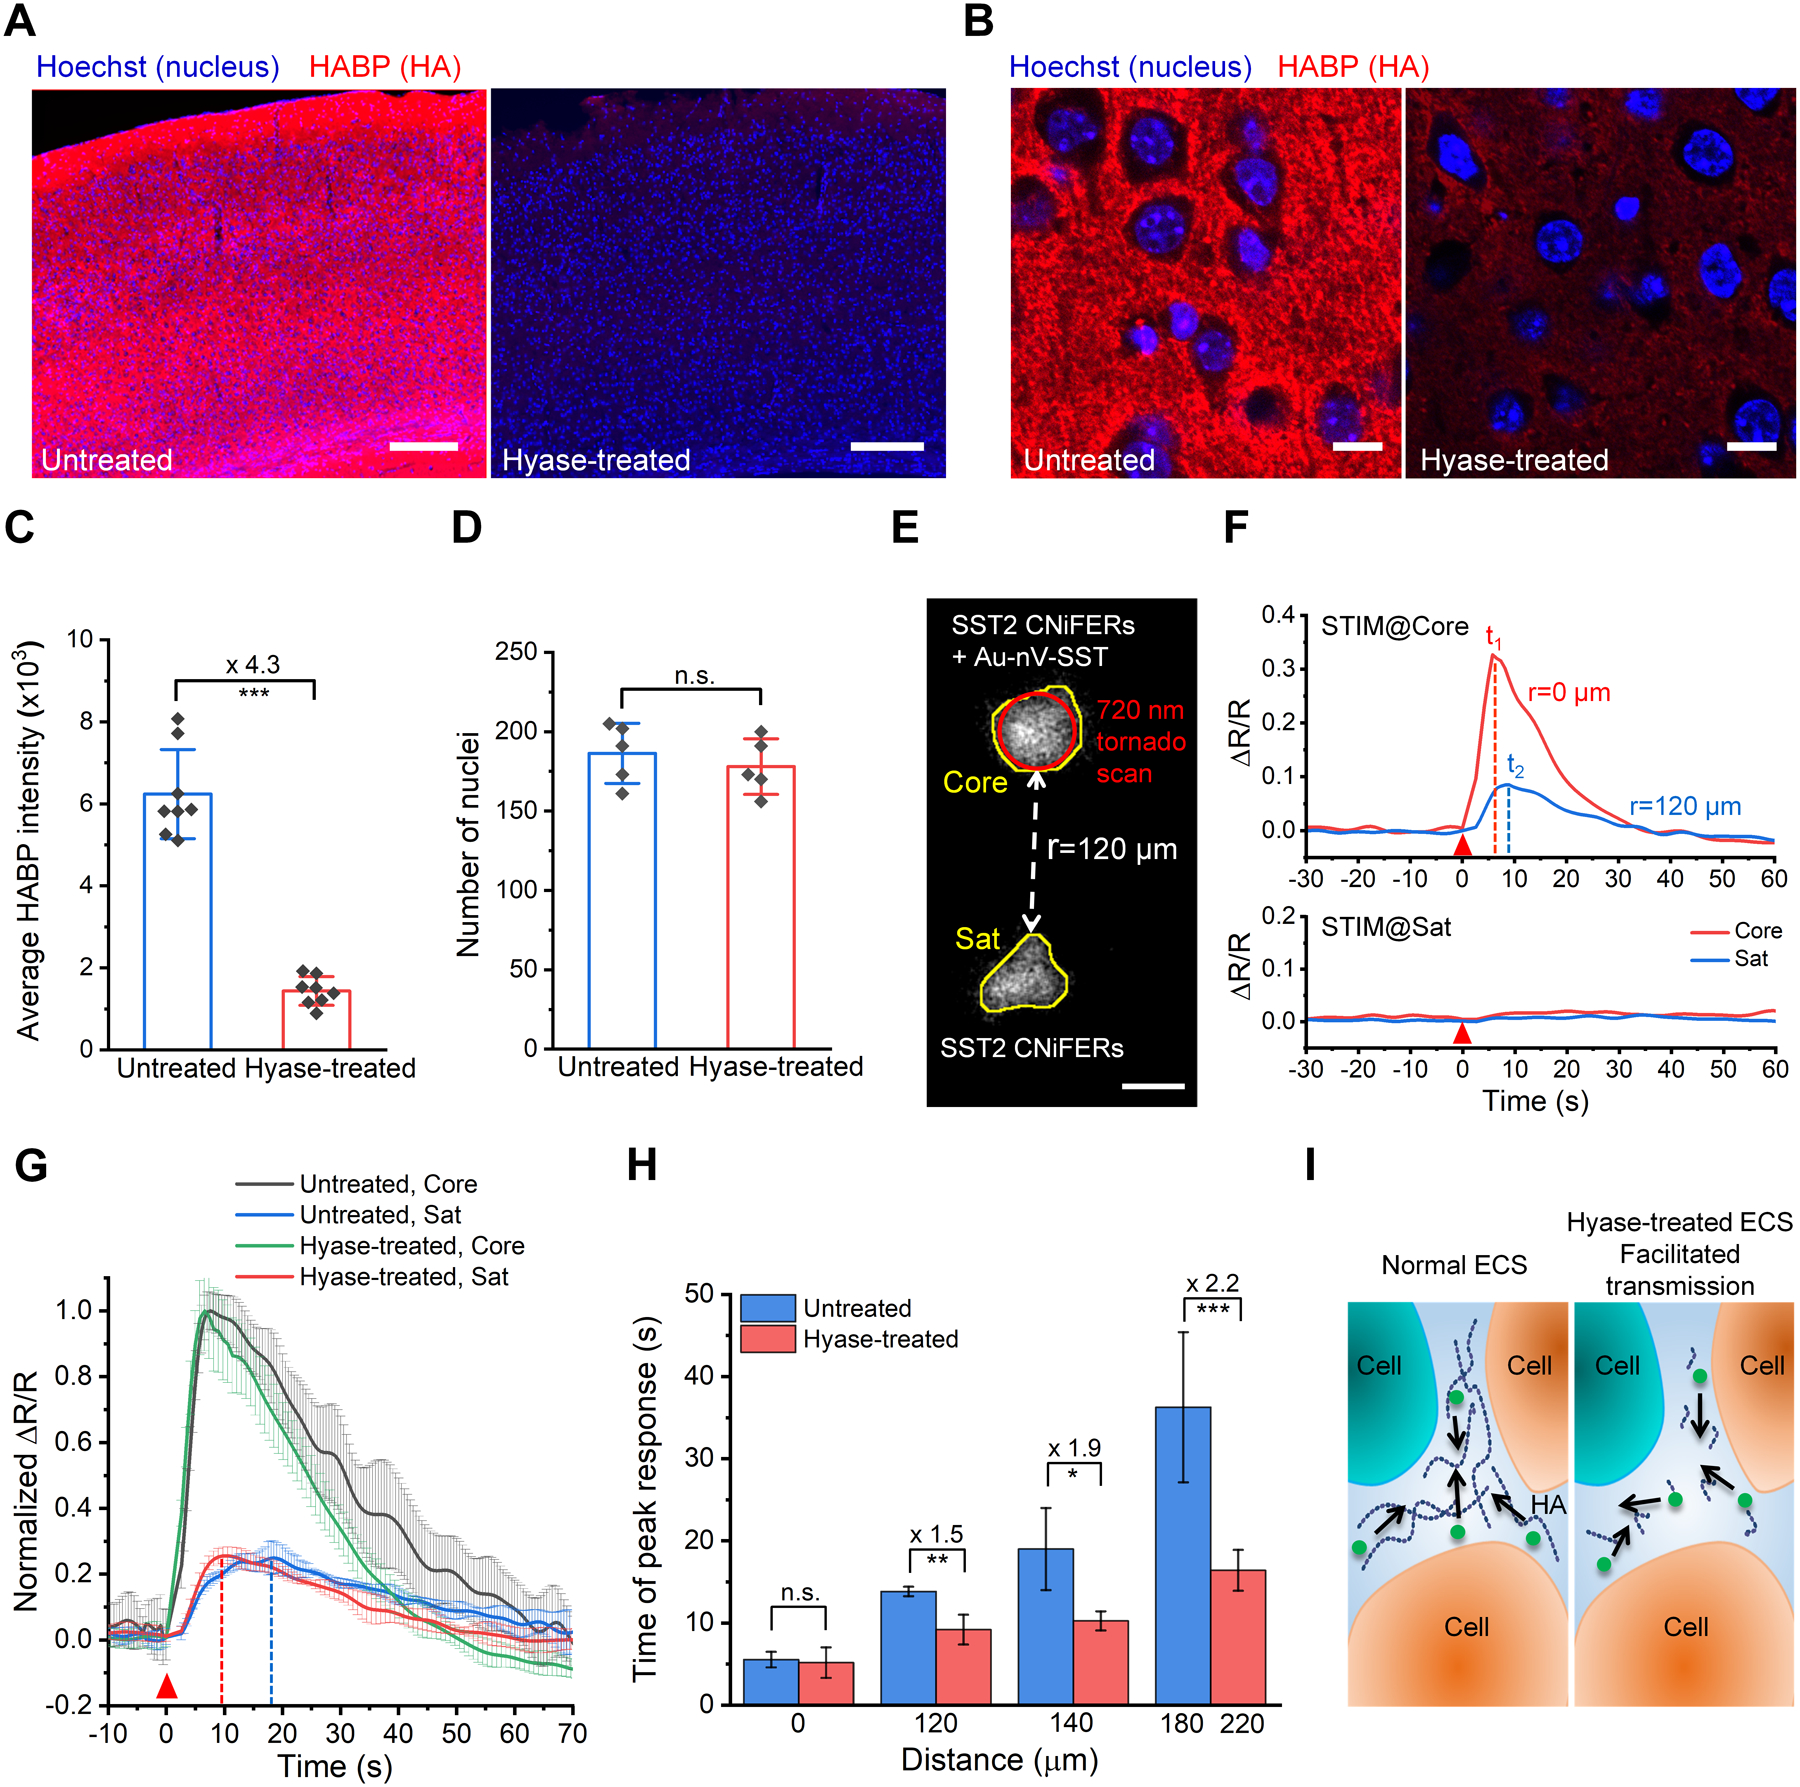
SST volume transmission in hyaluronan-deficient brains. A) Representative images of HABP-labeled (red) brain cortex sections from untreated mouse and hyaluronidase (hyase)-treated mouse. Nuclei were stained by Hoechst 33342 (blue). Scale bar: 200 μm. B) Confocal images of the brain cortex in the left hemisphere with high magnification. Scale bar: 10 μm. C) Average fluorescence intensity for HABP in mouse cortex (0.8 mm × 0.8 mm) of untreated and hyase-treated brains (n = 8 slices). D) Number of nuclei in the cortex of untreated and hyase-treated brains (n = 5 slices). E) Two-photon fluorescent image of SST2 CNiFERs implanted at a depth of 200 μm in mouse cortex. The top implant (Core) has SST2 CNiFERs mixed with Au-nV-SST, while the bottom implant (Sat) contains only SST2 CNiFERs. Scale bar: 50 μm. F) The response curves of SST2 CNiFERs when stimulating (STIM) at different regions (720 nm, 100 mW, 2.6 s). G) Comparison of normalized ΔR/R traces of the core implants (Core) and satellite implants (Sat) at the distance of 140 μm in untreated and hyase-treated brains (n = 3). H) Comparison of time of peak response over different distances in hyase-treated brains (n ≥ 4 measurements for each distance, 6 mice in total) and in untreated brains (acquired from Figure 3G). I) Schematic of the change in brain extracellular space (ECS) and SST volume transmission under different conditions. Data are expressed as Mean ± S.D.; *p < 0.05; **p < 0.01; ***p < 0.001; n.s., not significantly different.