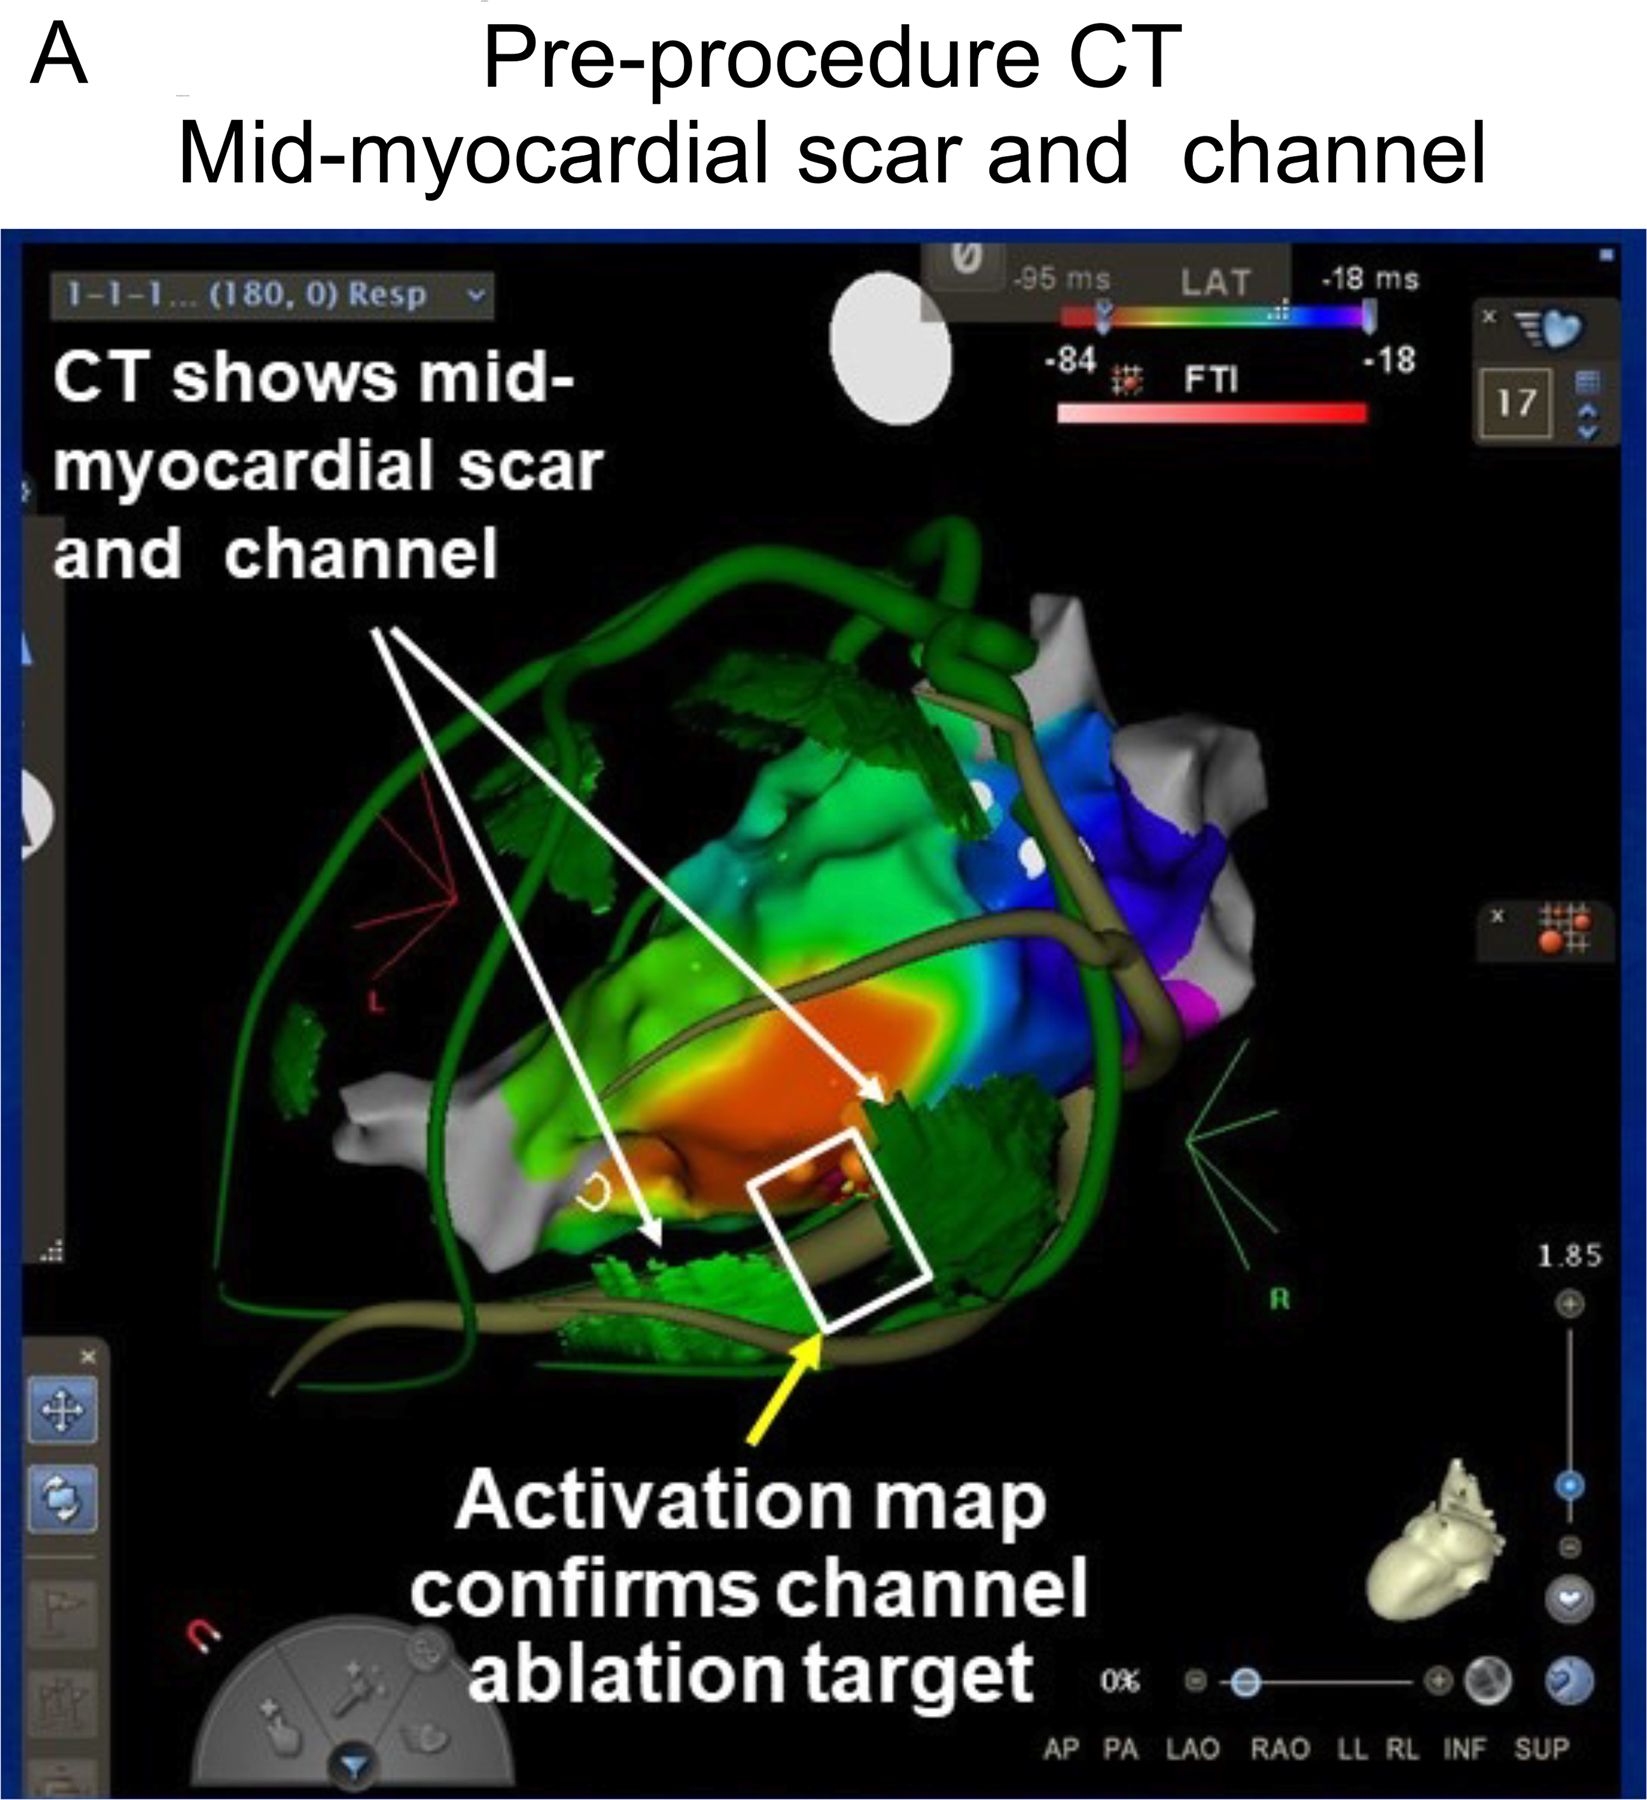
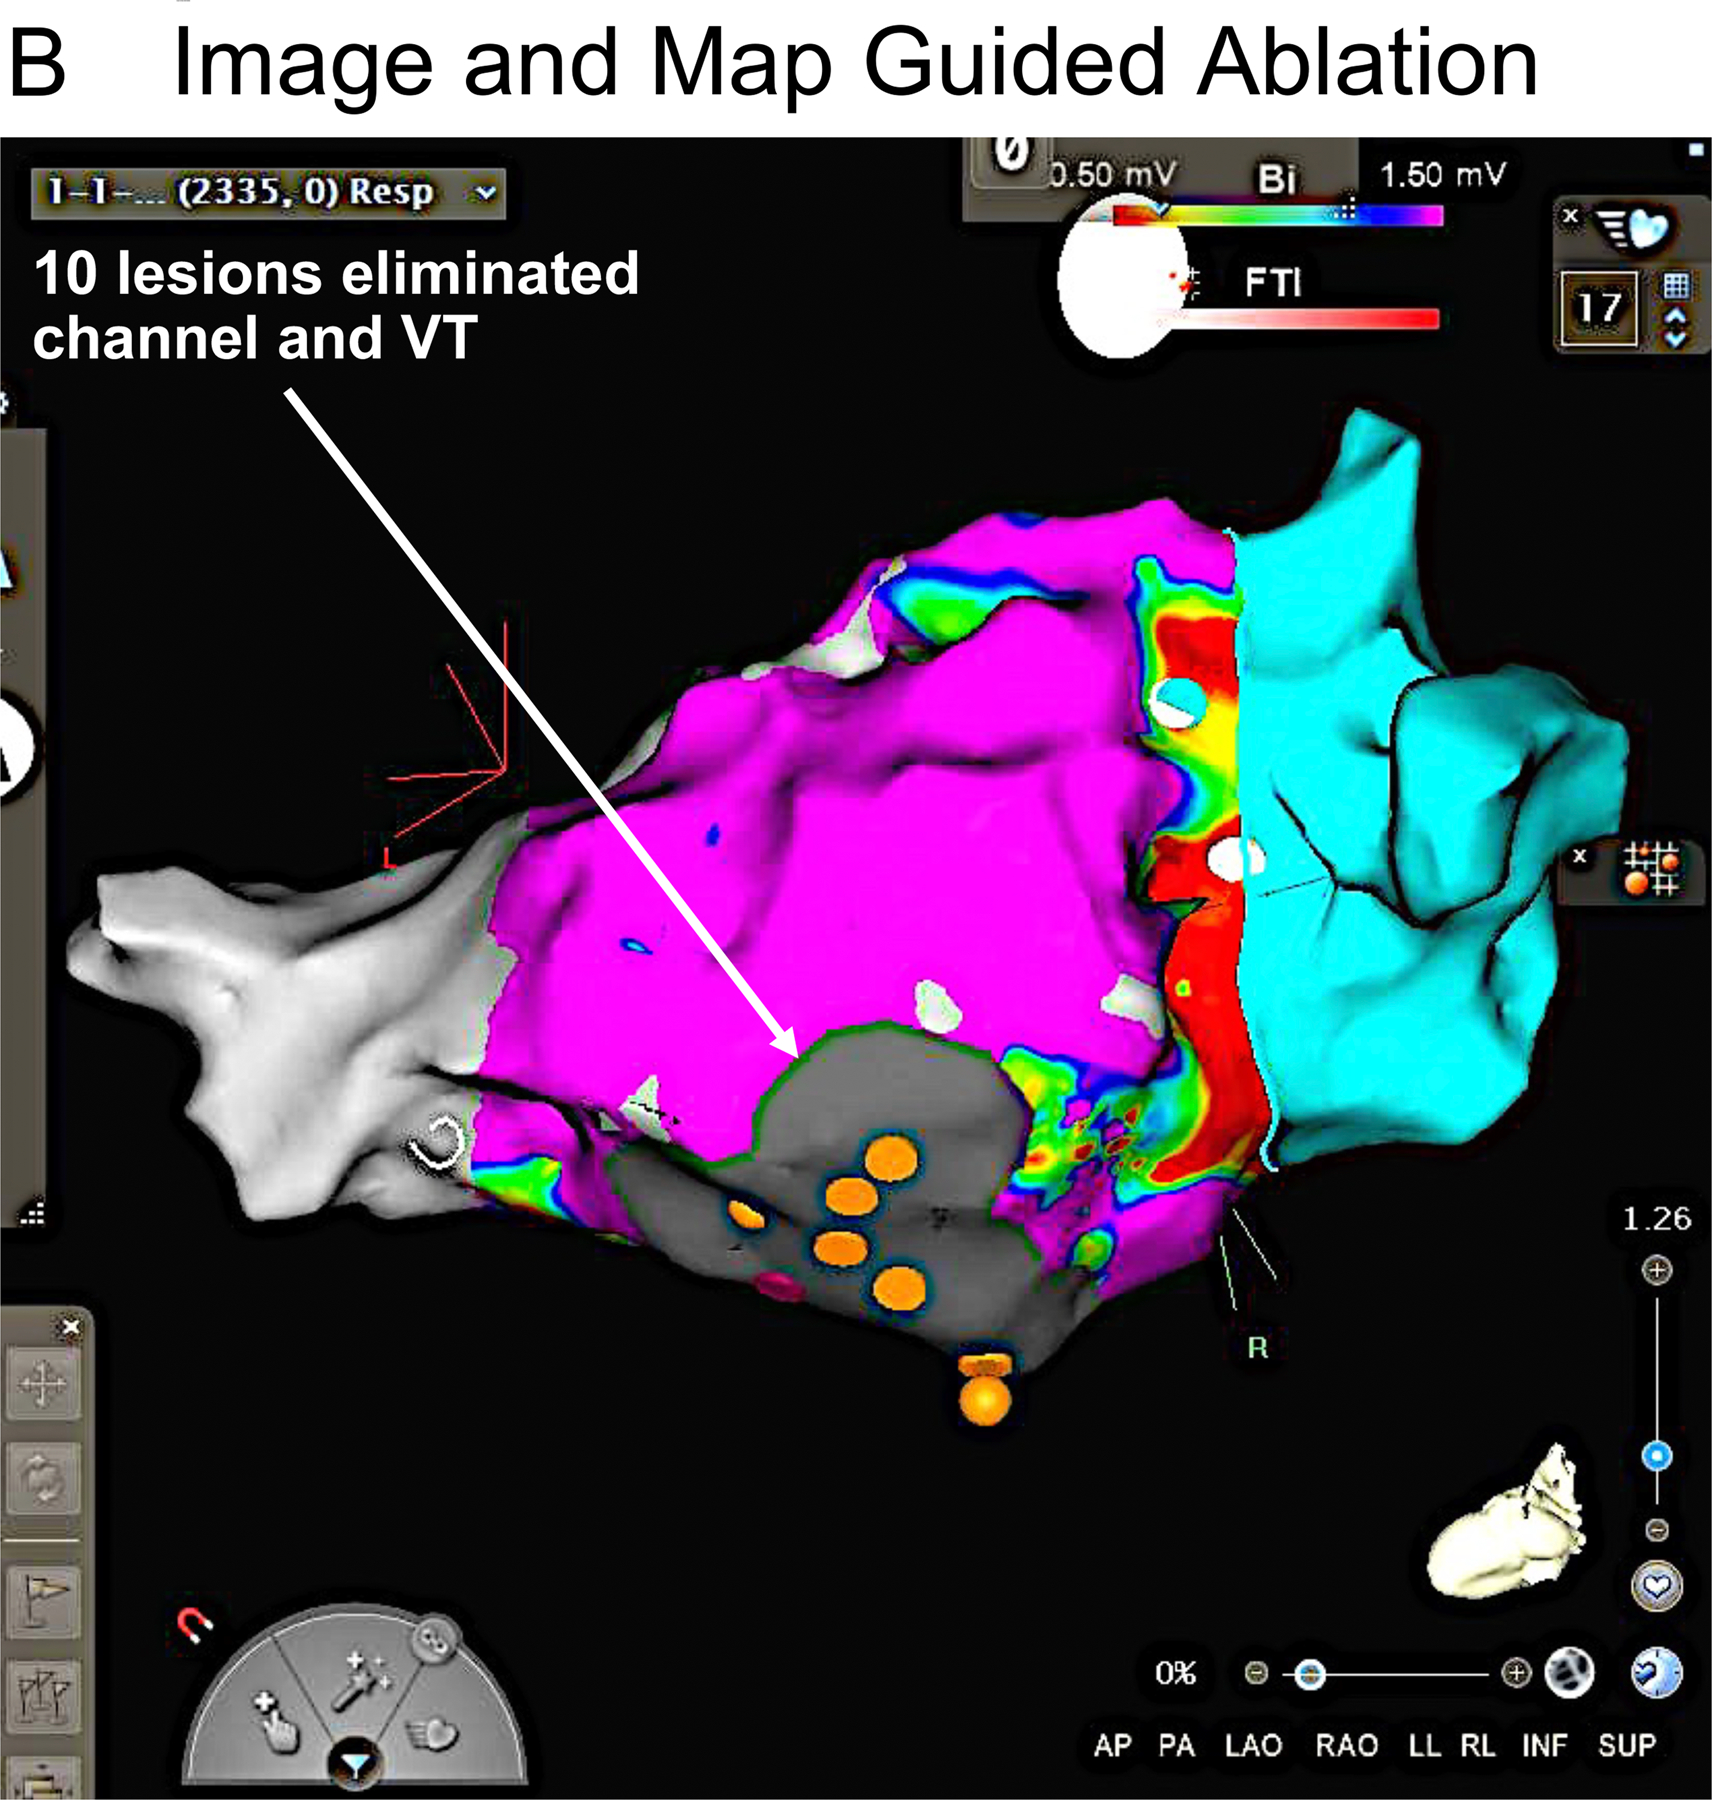
Figure 3.


A patient with recurrent VT due to nonischemic cardiomyopathy had 4 prior ablation procedures, with the last procedure using both endocardial and epicardial approaches. Panel A shows a pre-procedural CT registered with an electroanatomic endocardial activation map of VT. In the CT, green areas indicate thin regions of likely scar whose borders define a potential intramural channel (white rectangle). The activation map of VT (red earliest) shows an area of focal endocardial break out (earliest ventricular activation) overlying this channel. Within this region several areas of fractionated activity were present. The orange markers are ablation lesion sites. Following ablation, VT was no longer inducible. B. Endocardial voltage map suggested a large region of scar. Needle lesion sites are identified by the orange markers. Purple indicates electrogram amplitude > 1.5 mV.
