Figure 5.


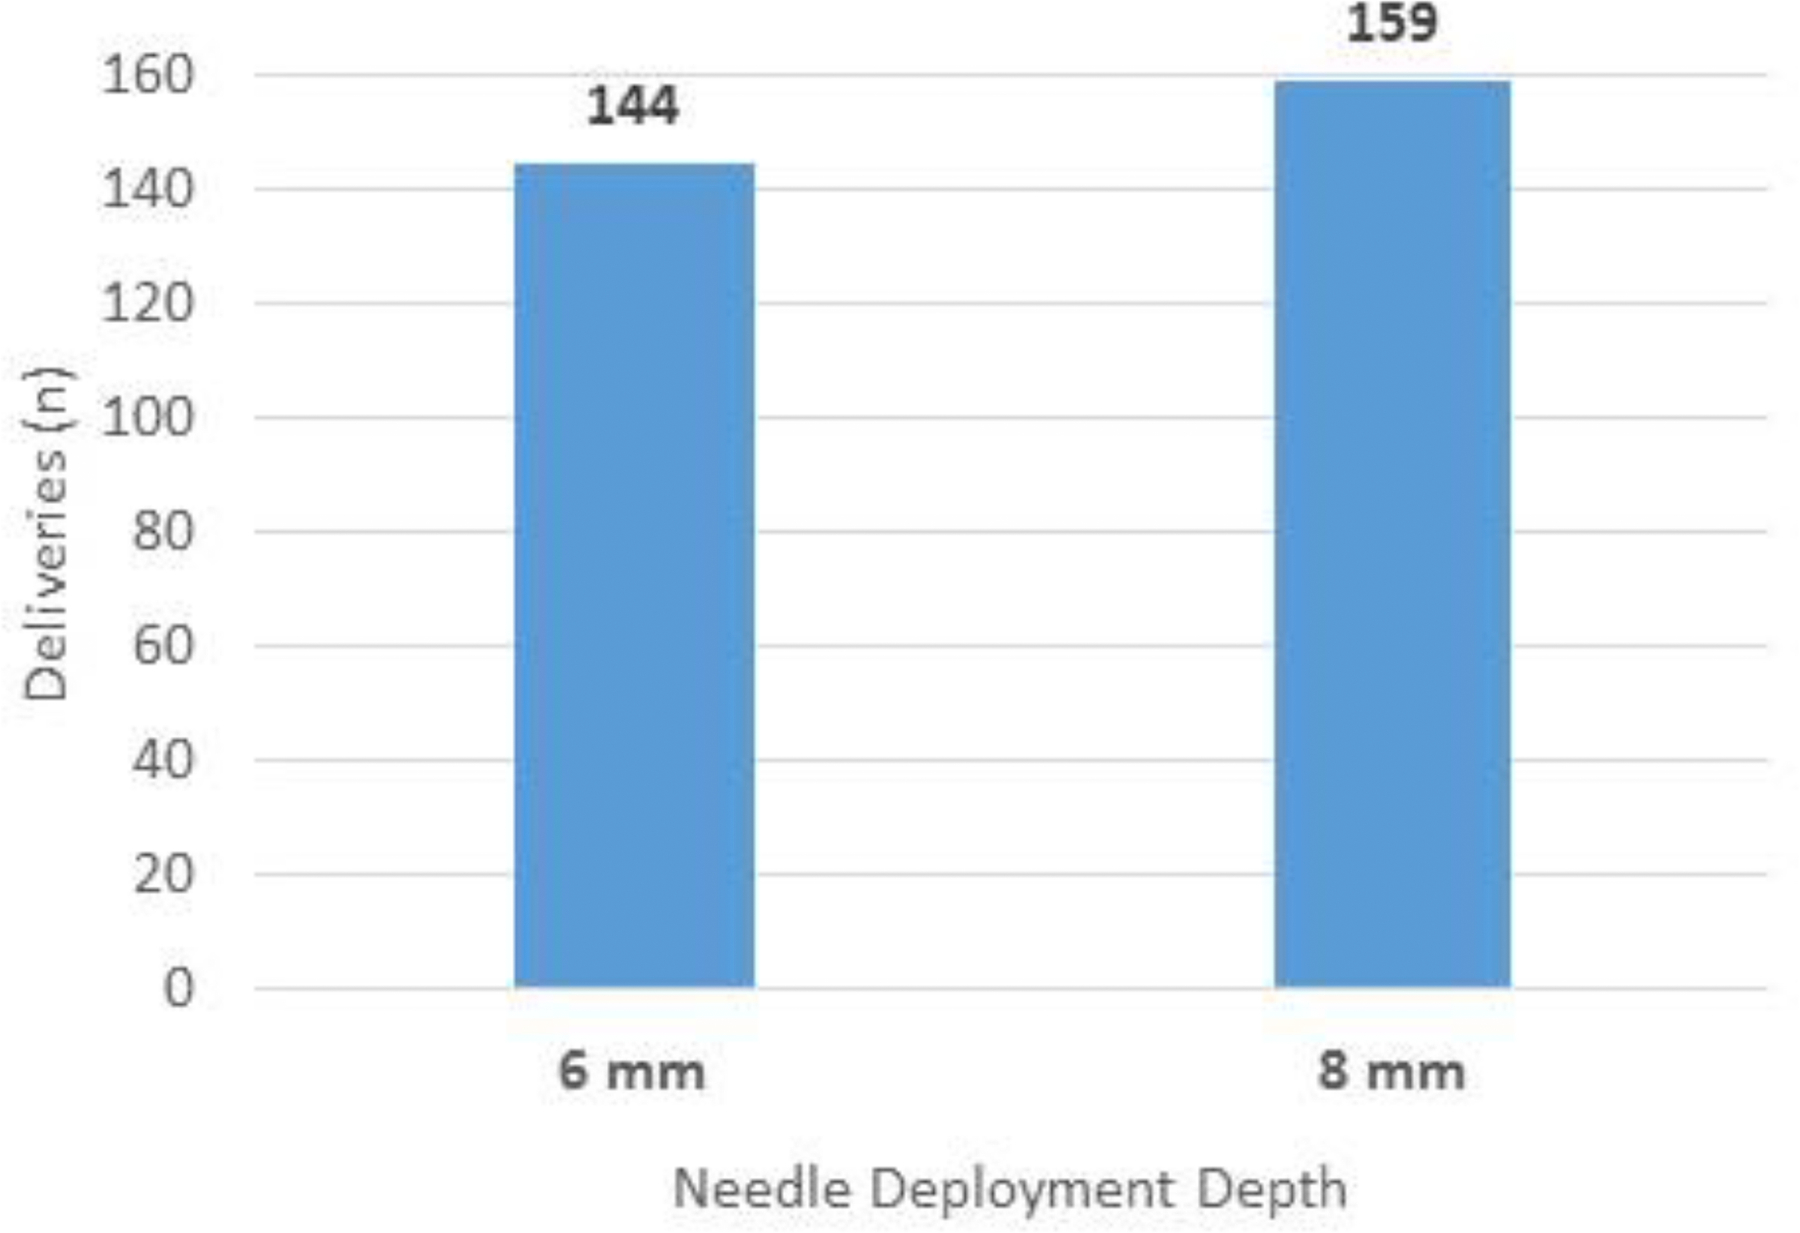
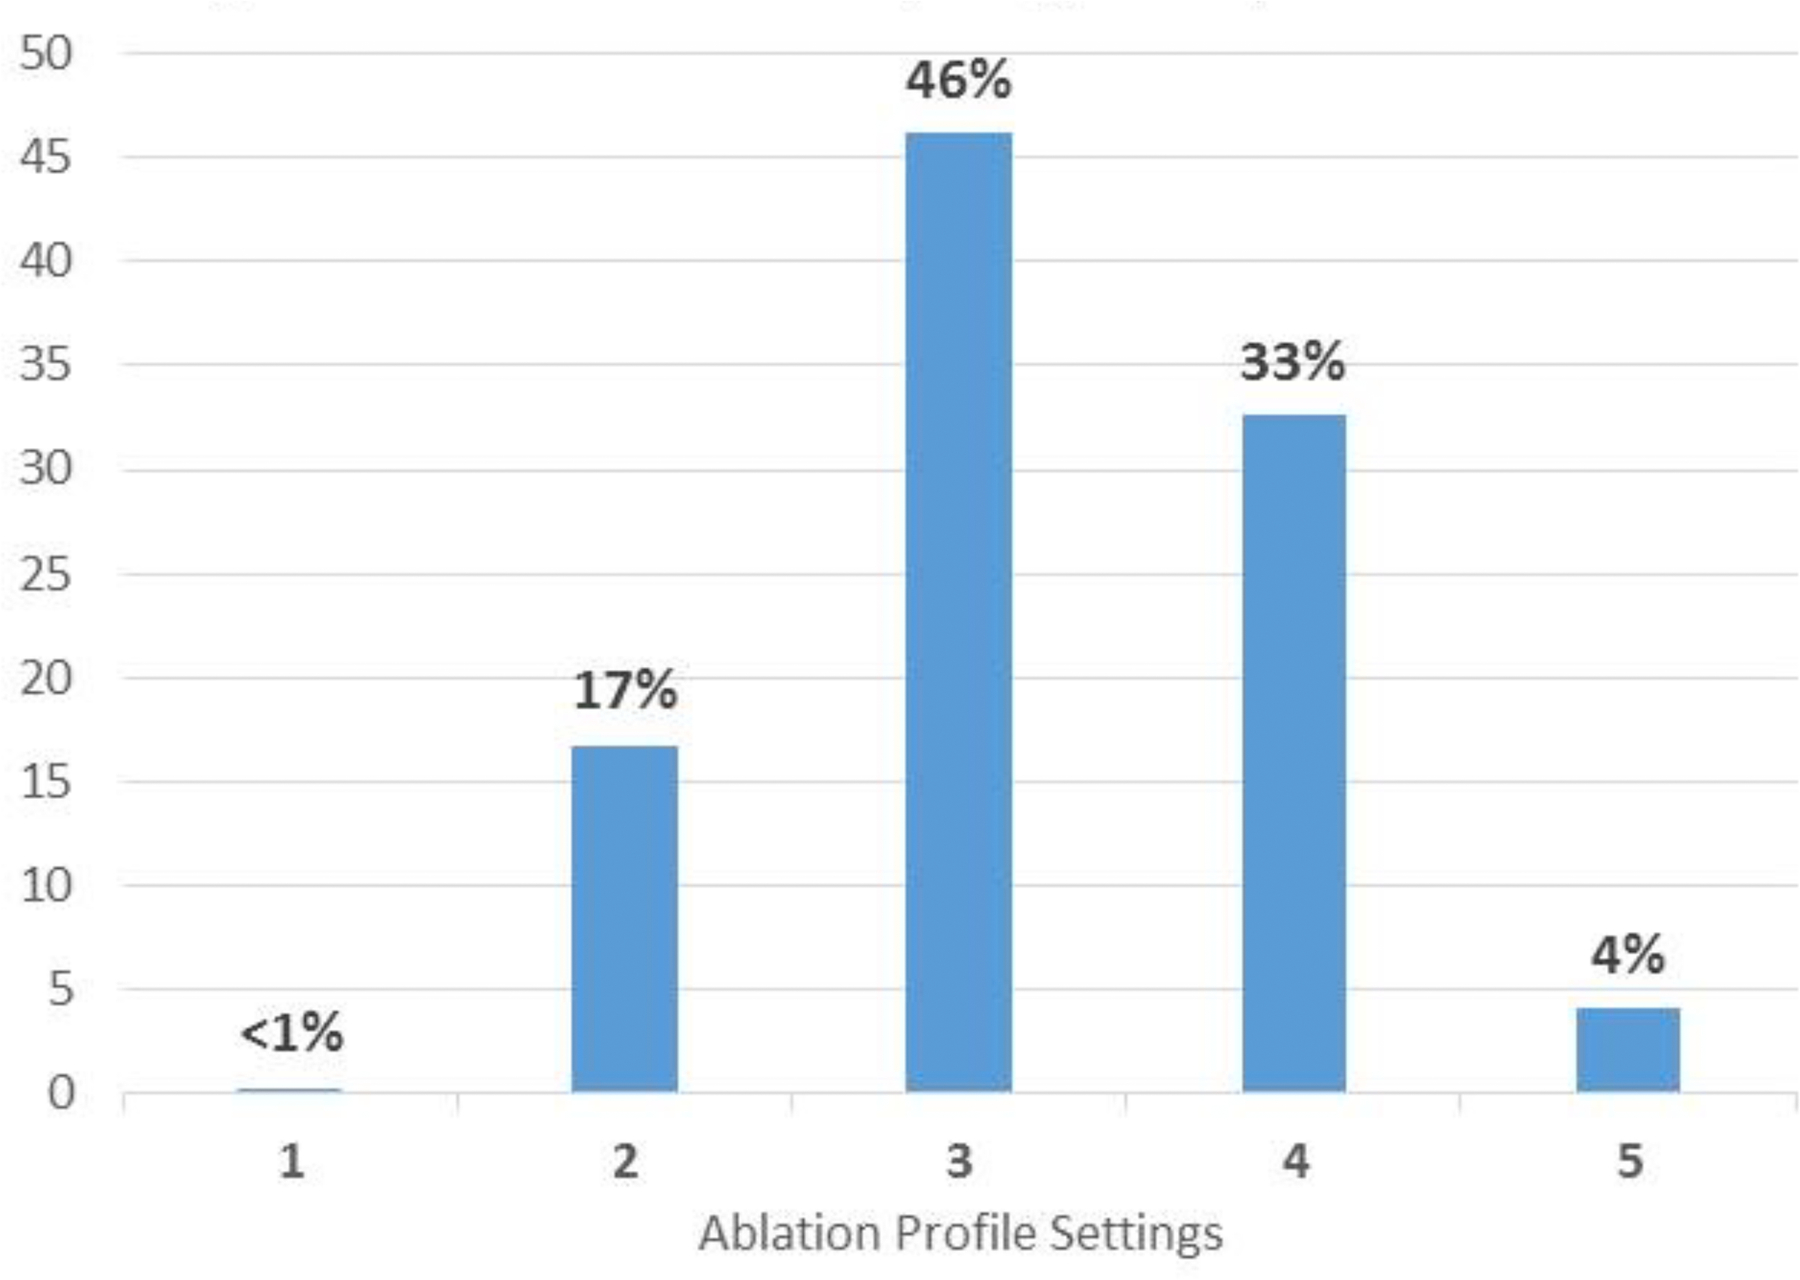
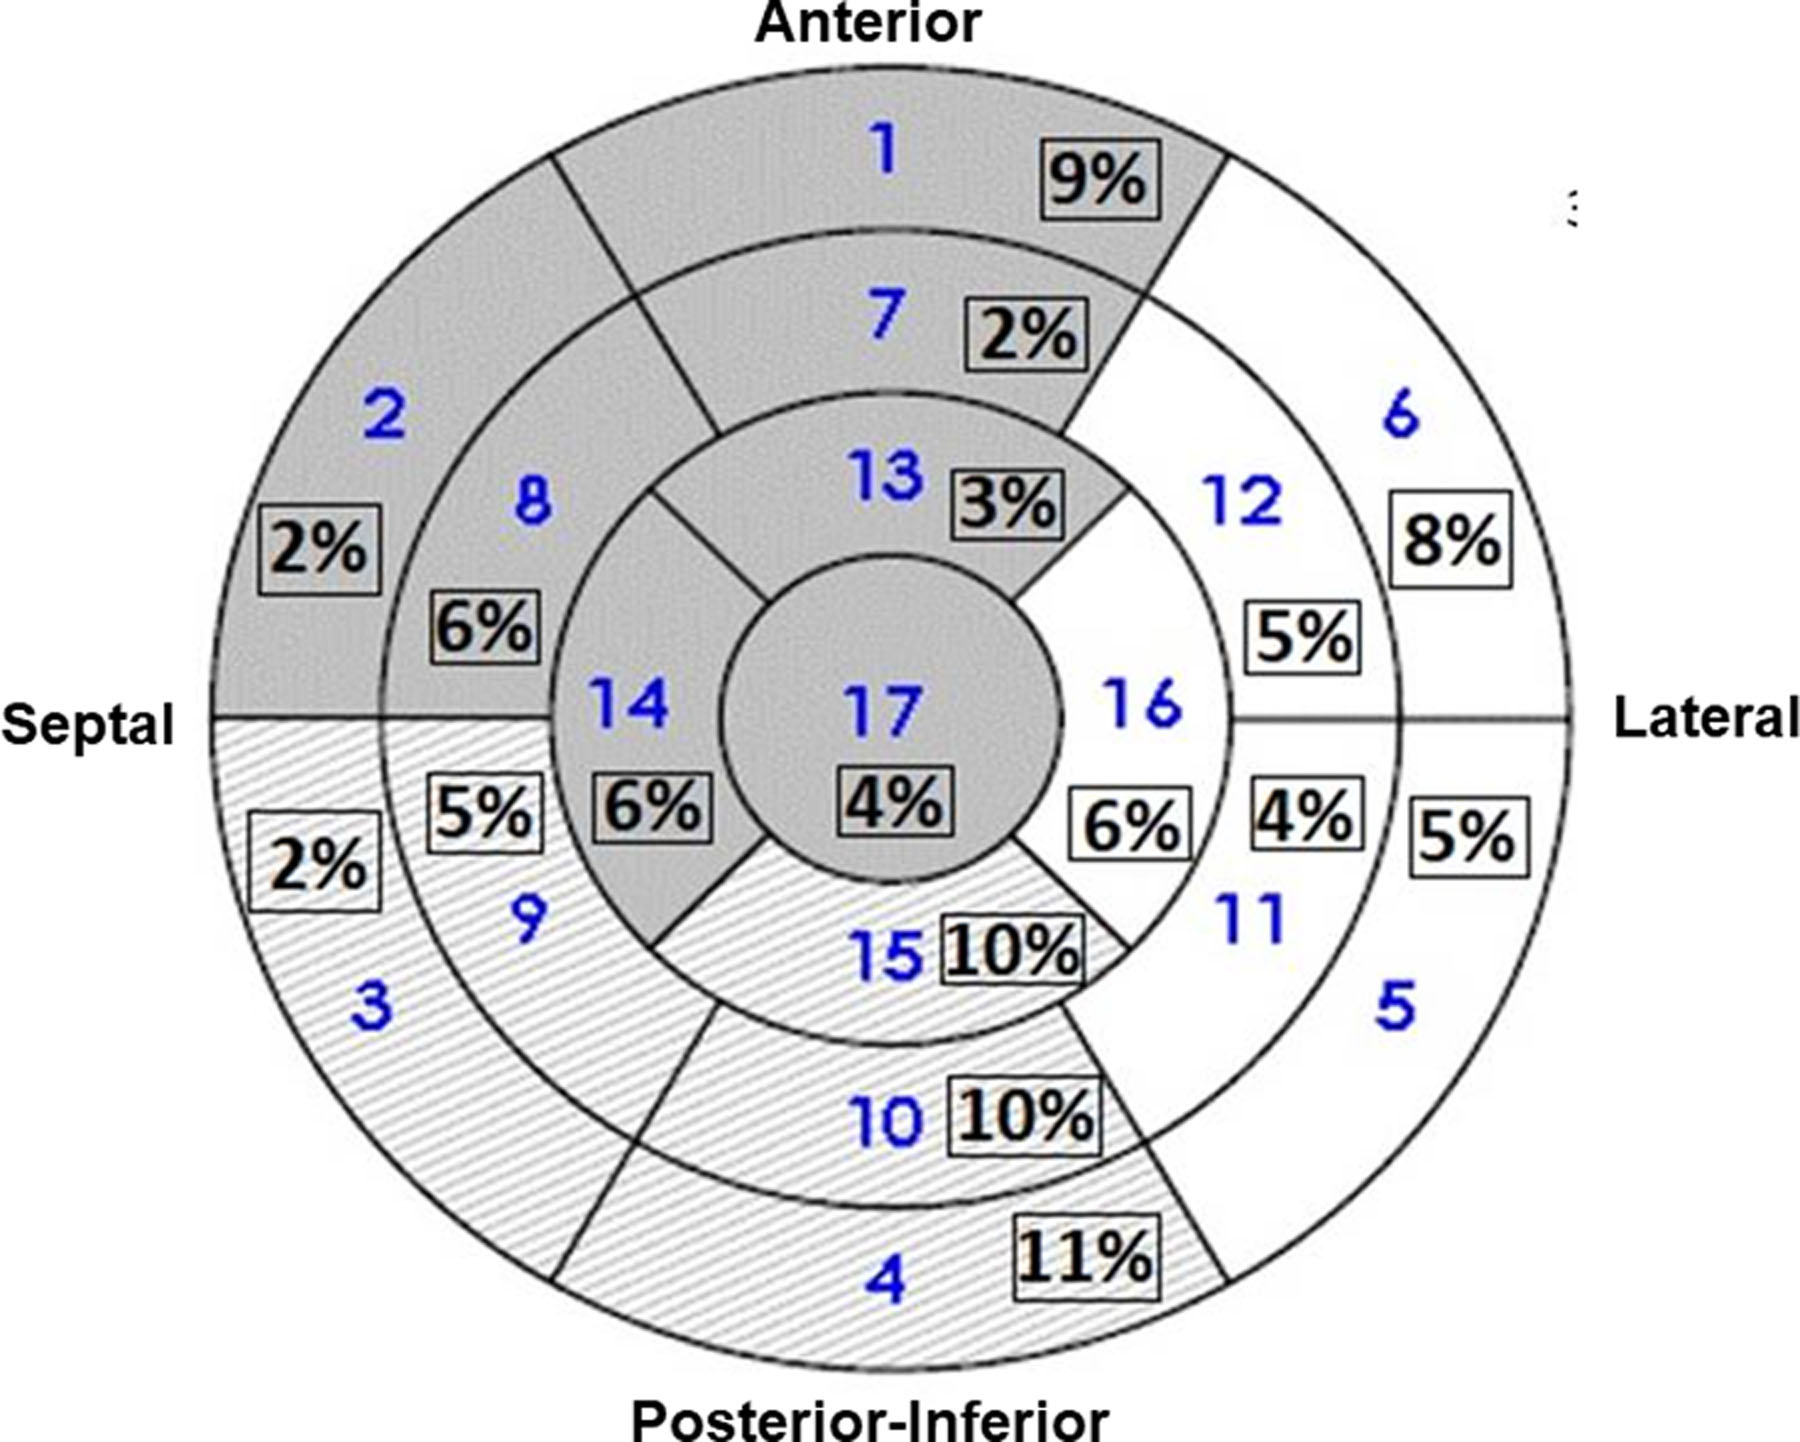
Characteristics of Needle Ablation of VT. A shows the number of energy deliveries at each depth. B shows the number of deliveries at each ablation setting seen in Table 2. C shows an LV polar map indicating the anatomic distribution of energy deliveries in all patients.
