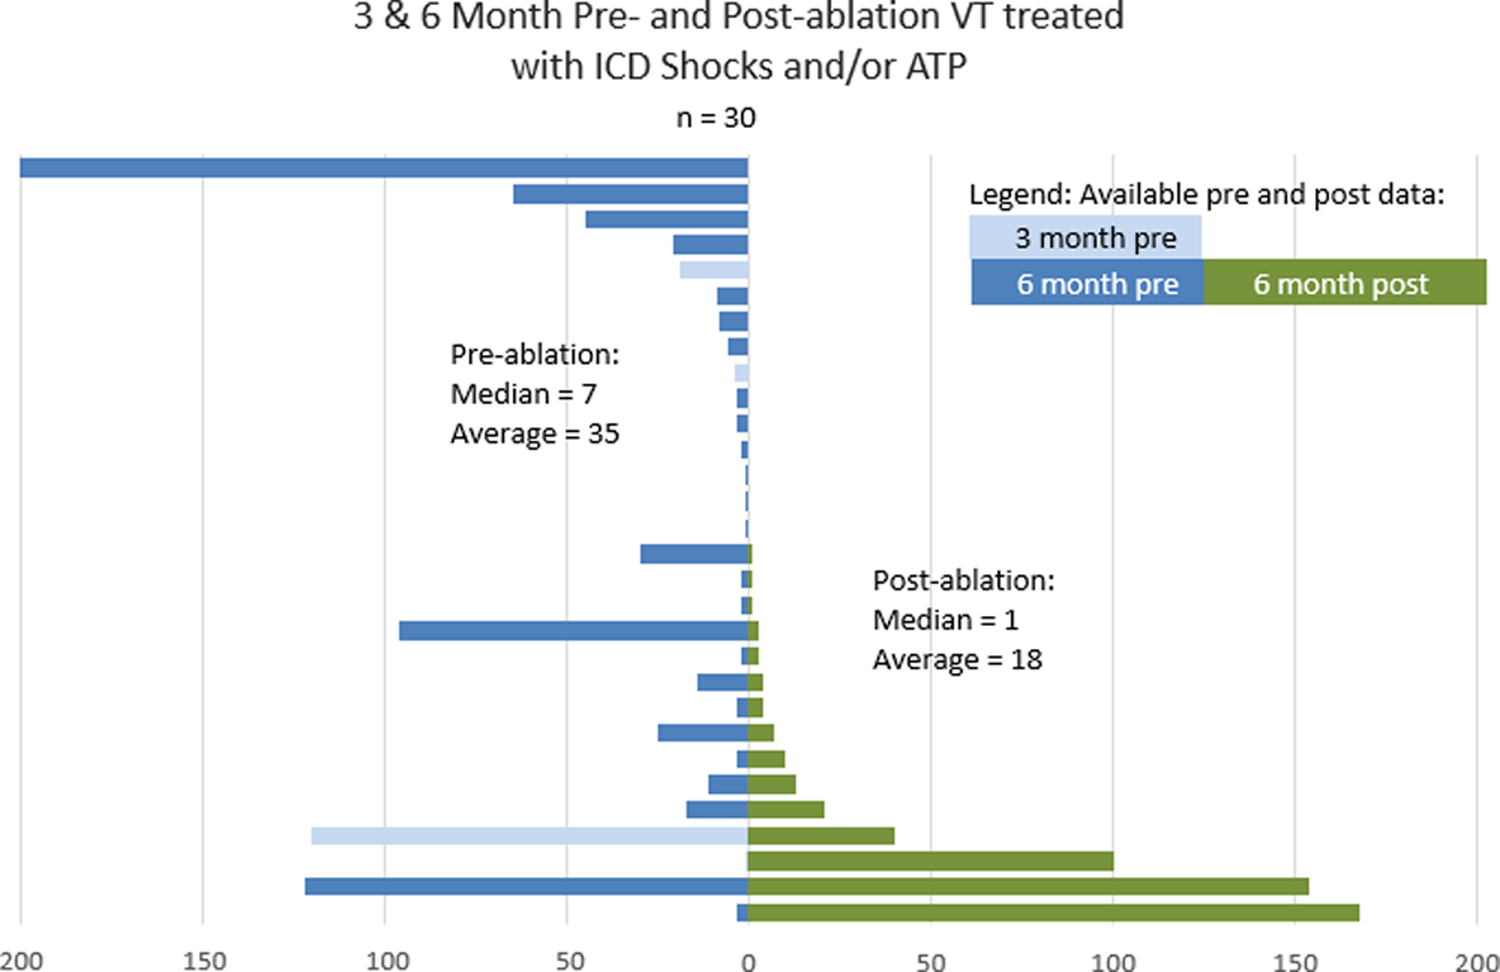
Figure 6.

Pre- and Post-Procedure VT Occurrences, and ICD/ ATP Therapies Under Both Circumstances. The blue bars indicate the pre-ablation frequencies of ICD shocks and ATP, while the green bars show the recurrences of the clinical events after ablation. ICD/ATP therapies were totally eliminated in 50% of all patients; there was a more than 90% reduction in 61% and more than 75% reduction in 78% of all patients, respectively. The spread in the standard deviation described on page 11 reflects the observation that several patients had ongoing ATPs, although this was seen in only 3 patients.
