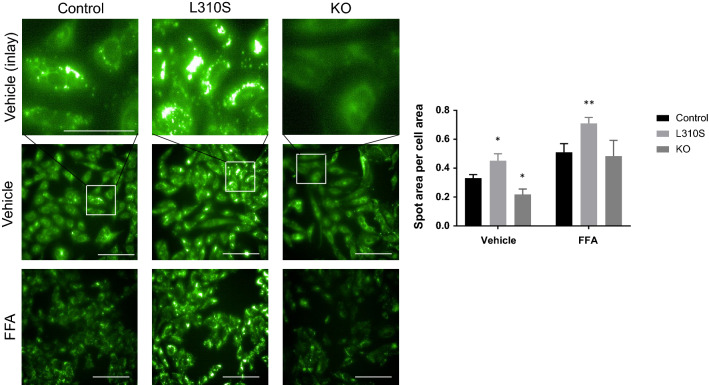
Figure 8.
Mutant SNU449 phenotypic characterization. (A) LipidTox neutral lipid stain reveals that under basal conditions, mutant SNU449 CRSIPR-Cas9 engineered cell lines show altered lipid burdens. The L310S line demonstrates an increased lipid burden and the KO line shows a reduced lipid burden. Under 25 µM free fatty acid treatment, all three lines demonstrate an increased lipid burden, with the L310S line demonstrating the greatest signal intensity for LipidTox neutral lipid stain. Scale bar represents 100 µM in all images, except for inlays where the scale bar represents 50 µM. Image thresholding was optimized for both vehicle and fatty acid conditions to highlight differences across lines. Within a treatment condition, image thresholding is constant. (B) Quantitative image analysis demonstrates a significant increase in LipidTox spot area per cell area in the L310S line relative to control (adjusted p-value of 0.0130). The KO line shows a significantly reduced lipid burden under basal conditions as measured by a significant decrease in neutral lipid spot area per cell area relative to control (adjusted p-value of 0.0213). Upon free fatty acid exposure the L310S line demonstrates a significant increase in lipid accumulation as measured by LipidTox spot area per cell area (adjusted p-value < 0.0001).

