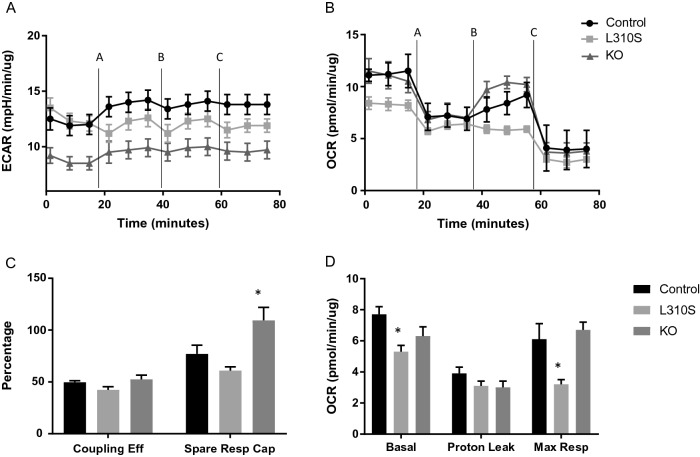
Figure 9.
Evaluation of mitochondrial functionality in the CRISPR-Cas9 engineered cell lines through extracellular flux analysis with a mitochondrial stress test involving the addition of oligomycin A (2.5 µM) indicated at time interval A, addition of FCCP (2.0 µM) at time interval B and addition of Rotenone Antimycin A (0.5 µM) at time interval C. Black (circle) indicates control, light gray (square) indicates L310S line and dark gray (triangle) indicates KO line. * indicates p-value < 0.05. (A) Extracellular acidification rate (mpH/min/µg) (ECAR) is a measurement of glycolysis in the mitochondrial stress test. The KO loss of function DPYD line demonstrates a significant reduction in the rate of glycolysis relative to the control and L310S line at all measured time intervals (adjusted p-value ≤ 0.0065). (B) Oxygen consumption rate (pmol/min/µg) (OCR) is a measure of mitochondrial respiration and L310S demonstrates a reduced rate of oxygen consumption at baseline and no increase in oxygen consumption with the addition of FCCP. The KO line demonstrates similar rates of oxygen consumption and responsiveness to too compounds, with the exception of the addition of FCCP. The KO line responds more rapidly to FCCP addition with a more significant increase in OCR. (C) There is no significant difference in coupling efficiency (Coupling Eff) across the three lines, but the KO line demonstrates a more significant increase in spare respiratory capacity (Spare Resp Cap) relative to the control line (adjusted p-value 0.0377). (D) The L310S line has a reduced basal OCR (adjusted p-value 0.0083) and a reduced rate of maximal respiration (Max Resp) (adjusted p-value 0.0201) relative to control.

