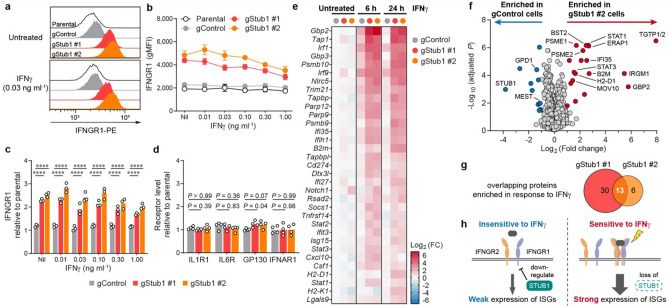
Figure 2.
Stub1 dampens IFNγ sensing by downregulating IFNGR1. (a–c) Flow cytometry analysis of cell surface IFNGR1 on parental, control or independent Stub1-null B16-F10 cells which were either untreated (Nil) or treated with IFNγ for 24 h. See Supplementary Fig. 3a for additional plots. (d) Flow cytometry analysis of the surface level of other cytokine receptors on the tumour cells. See Supplementary Fig. 3b–c for the plots. (e) Heatmap showing genes (Supplementary Table S3) being upregulated by > twofold in both gStub1 #1 and #2 cells relative to untreated gControl cells. The cells were treated with 0.03 ng ml−1 IFNγ for 6 or 24 h. See Supplementary Fig. 4a for the full heatmap. FC, fold change. (f) Volcano plot showing differential protein expression in gStub1 #2 versus gControl cells, following stimulation with 0.03 ng ml−1 IFNγ for 24 h. Red or blue circles highlight proteins significantly enriched in gStub1 #2 or gControl cells respectively (twofold cutoff, adjusted P ≤ 0.05; n = 6 replicates per cell group, 3 biological replicates × 2 MS replicates). See Supplementary Fig. 4e for data of gStub1 #1 cell. (g) MS proteomics uncovered 13 proteins commonly enriched in both gStub1 #1 and #2 cells. The overlapping proteins are explicitly labeled in panel (f). (h) Proposed model whereby Stub1 is an intracellular checkpoint that curbs the tumour cells’ ability to sense and respond to IFNγ by downregulating IFNGR1. Representative of three independent experiments (a). Data are mean ± s.d. (b) or mean with all data points (c) from three independent experiments. Data are mean with all data points from four independent experiments (d). P values were determined by ordinary two-way ANOVA (c) or one-way ANOVA (d) on Log2-transformed data with Dunnett’s multiple comparisons test, ****P ≤ 0.0001.

