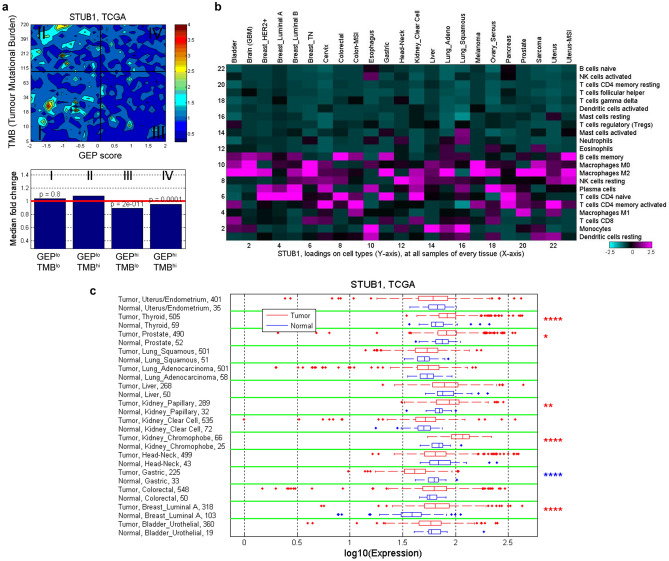
Figure 4.
Correlation and expression of STUB1 gene in TCGA dataset. (a) Contour plot illustrates the association of STUB1 with TMB and GEP. Blue and red represent under- and overexpression, respectively. TMB cut-off was set at 100 and GEP cut-off corresponds to 55th percentile value for pan-cancer cohort. (b) In-silico deconvolution analysis of bulk RNAseq data from TCGA was used to establish the association between STUB1 expression and different cell types. Deconvolution analysis was performed separately for each tumor type. (c) Expression of STUB1 in tumor tissue and adjacent normal tissue is compared across tumor types for which both tumor and adjacent normal samples are available in TCGA dataset. The significance of the difference is indicated with *P ≤ 0.05, **P ≤ 0.01, and ****P ≤ 0.0001.

