Figure 6.
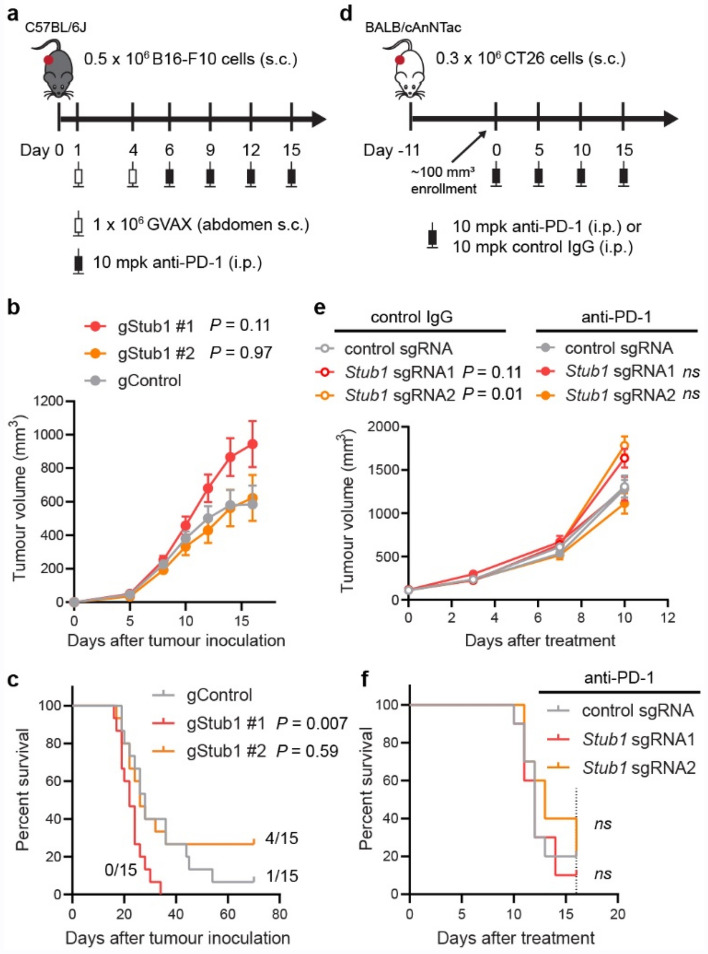
The effect of Stub1 deletion in mouse syngeneic tumour models. (a) Study design for C57BL mice implanted with CRISPR-edited B16-F10 clonal cells. s.c., subcutaneous. i.p., intraperitoneal. mpk, milligram per kilogram. (b) Plot showing tumour volume of the implanted CRISPR-edited B16-F10 clonal cells. Data are mean ± s.e.m., n = 15 mice per group. See Supplementary Fig. 9b–d for individual tumour volume across 70 days. (c) Kaplan–Meier survival curves of tumour-bearing mice. Median survival: gControl, 28 days; gStub1 #1, 22 days; gStub1 #2, 26 days. Either 1 or 4 out of 15 mice bearing gControl or gStub1 #2 tumour cells respectively were still alive at day 70. (d) Study design for BALB mice implanted with CRISPR-edited CT26 cells. See Supplementary Fig. 10 for full characterization of the cells. (e) Plot showing tumour volume of the implanted CRISPR-edited CT26 cells. Data are mean ± s.e.m. See Supplementary Fig. 9f.–h and 8j–l for individual tumour volume across 16 days. (f) Kaplan–Meier survival curves of tumour-bearing mice treated with anti-PD-1 antibody. Median survival: control sgRNA, 12 days; Stub1 sgRNA1, 12 days; Stub1 sgRNA2, 13 days. The study was terminated at day 16 (dotted line). See Supplementary Fig. 9i for the survival curves of mice treated with control antibody. n = 10 mice per group (e, f). P values were determined by ordinary one-way ANOVA on day 16 data (b) or two-way ANOVA on day 10 data (e) versus control tumours with Sidak’s multiple comparisons test, ns P ≥ 0.50. P values were determined by Log-rank (Mantel-Cox) test versus control tumours (c, f), ns P ≥ 0.50.

