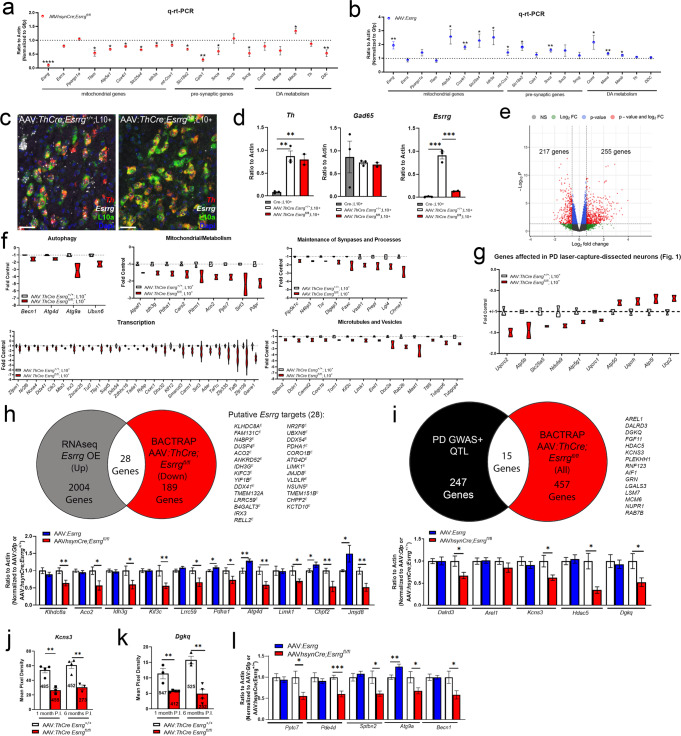
Fig. 6. BAC-TRAP from mice lacking Esrrg in DAergic neurons revealed genes related to autophagy, mitochondrial and synaptic function, transcription, and microtubule- and vesicle-related pathways.
a, b q-rt-PCR data from midbrain of mice lacking Esrrg (AAV-hsynCre Esrrgfl/fl vs. AAV-hsynCre Esrrg+/+) or of mice overexpressing Esrrg (AAV-Esrrg vs. AAV-Gfp) (n = 7–8/group; two-tailed unpaired t-test *p < 0.05, **p < 0.01). c Representative images from sm-FISH for Th (red), Esrrg (white), endogenous GFP-L10a (green), and DAPI (blue) in Esrrg+/+;L10+ and Esrrgfl/fl; L10+ mice injected with AAV:ThCre to induce the Gfp-Rpl10a transgene in DAergic neurons. d q-rt-PCR from BAC-TRAP pulldowns for Th, Gad65 and Esrrg transcript for confirmation of enrichment of DAergic markers and exclusion of inhibitory neuron markers (n = 2–3/group; one-way ANOVA with Tukey’s post hoc analysis **p < 0.01, ***p < 0.001). e Volcano plot showing differentially expressed genes in AAV:ThCre-injected Esrrg+/+;L10+ and Esrrgfl/fl; L10+ mice after sequencing (gray = no significance, green = ±1.5 log2-fold change, blue = significant padj value, red = significant padj value and differentially expressed ±1.5 log2-fold change). f Fold control expression of genes downregulated with Esrrg deletion by functional category. g Fold control of ETC genes reduced in PD patients that had significant padj values but not ±1.5 log2 fold change. h Pie chart demonstrating overlap between genes changed with Esrrg overexpression in SH-SY5Ys and genes changed with Esrrg knockout with BAC-TRAP. Q-rt-PCR with Esrrg knockout or overexpression from genes identified as putative targets of Esrrg (n = 5–8 mice/group; two-tailed unpaired t-tests *p < 0.05, **p < 0.01). i Overlap of predicted PD GWAS and QTL genes and genes changed with Esrrg knockout using BAC-TRAP in DAergic neurons. qPCR from targets in both Esrrg knockout and overexpression in the midbrain (n = 5–8 mice; two-tailed unpaired t-test *p < 0.05). j, k sm-FISH for the identified targets Kcns3 and Dgkq at both 1 and 6 months P.I. of AAV-ThCre (n = 3–4/group; two-tailed unpaired t-test *p < 0.05, **p < 0.01). l q-rt-PCR from Esrrg knockout (AAV-hsynCre) or overexpression (AAV-Esrrg) midbrain homogenate for autophagy and microtubule and vesicle-related genes (n = 5–8 mice/group; two-tailed unpaired t-test *p < 0.05, **p < 0.01, ***p < 0.001). Numbers on bars are cell counts from each experimental group. Scale bars correspond to 50 µm (c). Error bars represent ± SEM.

