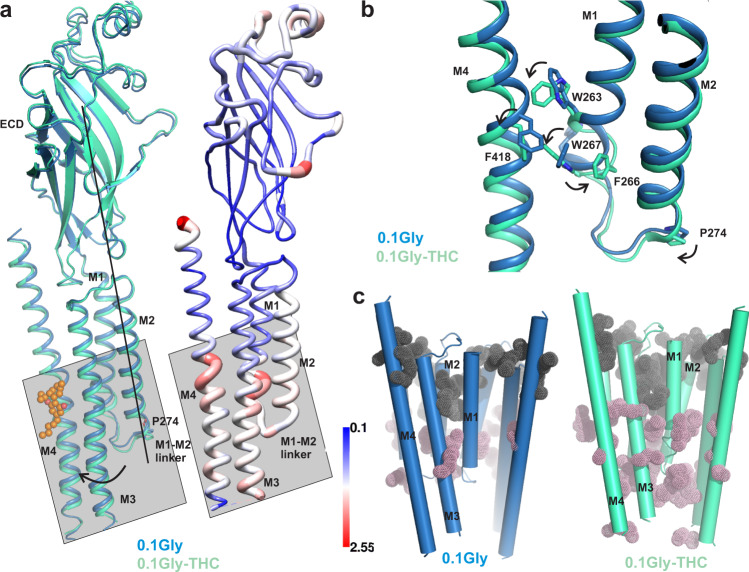
Fig. 3. THC-induced conformational changes within the TMD.
a A single-subunit alignment of GlyR-0.1gly and GlyR-0.1gly-THC structures highlighting the overall conformational changes associated with THC binding (left). Putty representation of pairwise root mean square deviation (RMSD) for the GlyR-0.1gly and GlyR-0.1gly-THC structures (right). The gray box points out regions that show most positional differences. b A close-up view of the alignment of GlyR-0.1gly and GlyR-0.1gly-THC structure showing rotameric rearrangement of residues in the vicinity of the THC binding site. c A comparison of the inter-subunit (gray dots) and intra-subunit (pink dots) cavities in GlyR-0.1gly (left) and GlyR-0.1gly-THC (right) predicted using F pocket algorithm72. The cavities predicted on the surface were removed for clarity.

