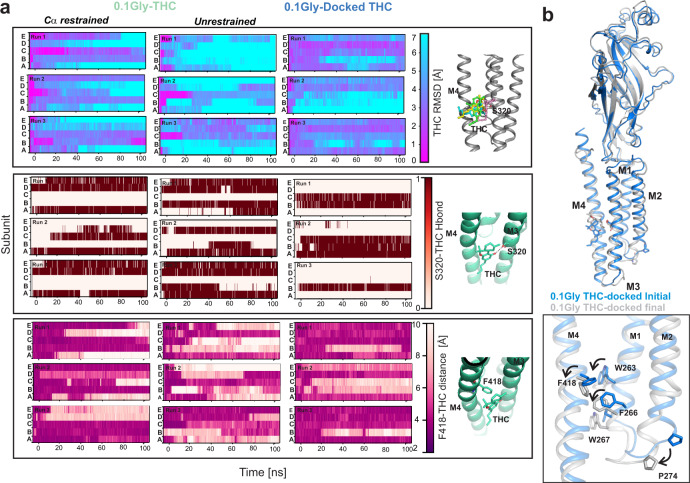
Fig. 5. Assessment of THC binding pose.
a The stability of the THC binding pose was assessed in the GlyR-0.1gly-THC structure during simulations with either Cα-restraints or under unrestrained conditions. The THC molecule was also docked on to the GlyR-0.1gly structure in the same binding pose as observed in the GlyR-0.1gly-THC structure. The time evolution of the RMSD of the heavy atoms of each THC molecule with respect to the starting conformation was computed for the three repeats for each simulated system (top panel). Prior to the calculation of each THC RMSD, a least-squares fitting was performed on the Cα atoms of the protein subunit where the respective THC was bound. Inset on the right shows the different THC orientations during unrestrained simulation. The number of hydrogen bonds formed between the oxygen or the hydroxyl group of THC and the Ser320 sidechain located on the M3 helix, for the three repeats for each simulated system. The criteria for considering hydrogen bond formation was that the O··O distance was below 3.5 Å and the H-O··O angle was below 30° (middle panel). The minimum distance between Phe418 sidechains and THC molecule during the three repeats for each simulated system (bottom panel). b Single subunit alignment of initial and final states of GlyR-0.1gly THC-docked structure highlighting overall conformational changes associated with THC binding during simulation.

