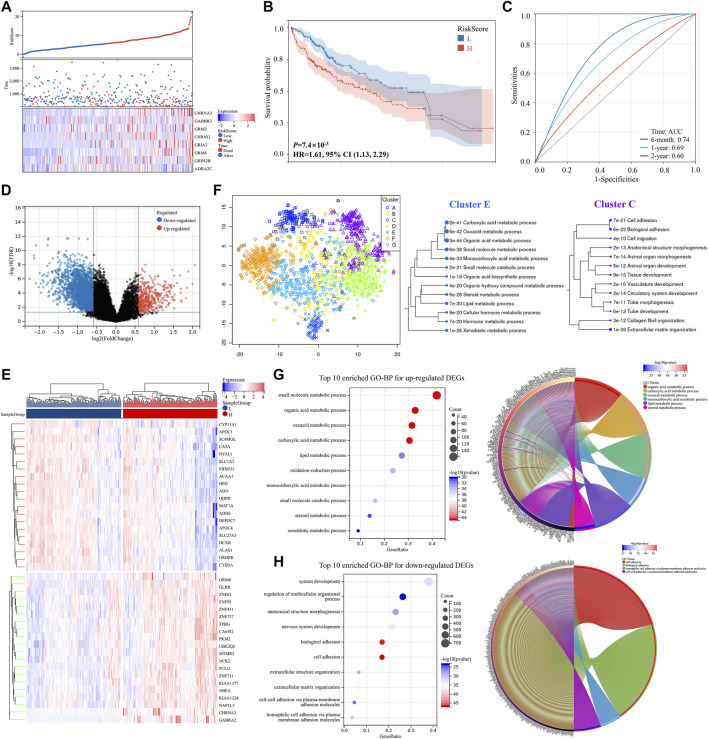
FIGURE 4.
DEGs validation and potential pathway enrichments in the TCGA-LIHC dataset. (A) Distribution of the risk scores, survival status, and expression of the eight critically predictive genes. (B) The Kaplan–Meier analysis of overall survival in the high-risk scores group and low-risk scores group. (C) The ROC analysis to evaluate the predictive efficiency of risk scores. (D) Volcano plot of DEGs. (E) Heat map of DEGs between two groups. (F) Map and clusters of DEGs using t-SNE. (G,H) Top 10 enriched GO-BP and circle plots for DEGs in the TCGA-LIHC datasets. DEGs, differentially expressed genes; t-SNE, t-Distributed Stochastic Neighbor Embedding; GO, gene ontology; BP, biological process. ROC, receiver operator characteristic.

