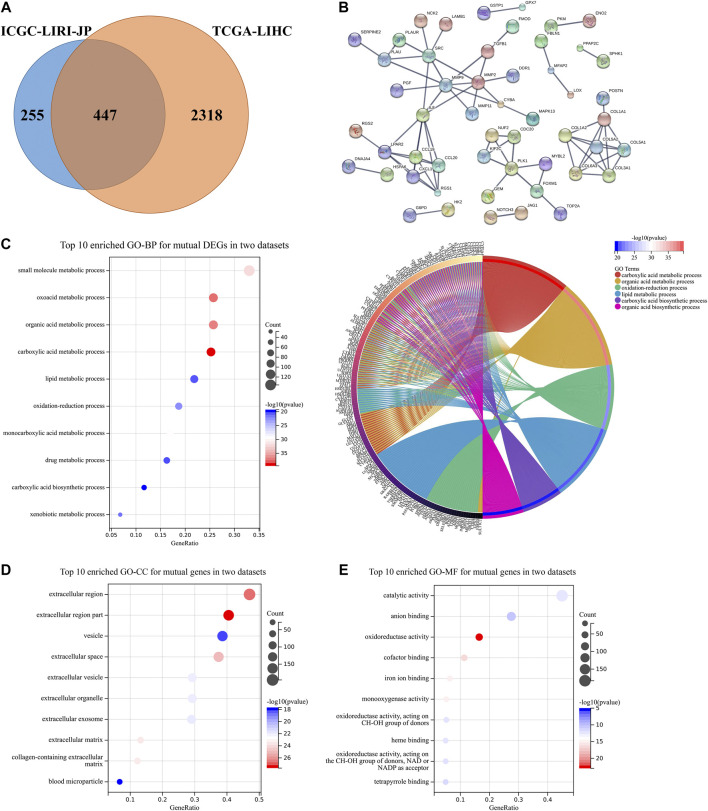
FIGURE 5.
DEGs validation and potential pathway enrichments both in the TCGA-LIHC dataset and the ICGC-LIRI-JP dataset. (A) Venn diagram was constructed to show DEGs both in the TCGA-LIHC dataset and the ICGC-LIRI-JP dataset. (B) PPI construction of DEGs both in two datasets. (C) Top 10 enriched GO-BP and circle plots for mutual DEGs. (D,E) Top 10 enriched GO-CC and GO-MF for mutual DEGs. DEGs, differentially expressed genes; GO, gene ontology; BP, biological process; CC, cellular component; MF, molecular function; PPI, protein-protein interaction.

