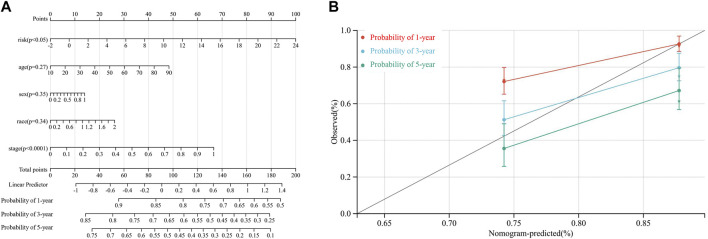
FIGURE 7.
. Nomogram to predict the probability of a 1-year, a 3-year, and a 5-year OS in patients with HCC based on the TCGA-LIHC dataset. (A) the nomogram was constructed based on five clinical factors, and results suggested that the risk score and TNM stage significantly affected the OS of patients with HCC. For the factor sex, 0 represents male and 1 represents female; for the factor race, 0 represents the white, 1 represents the Asian, and 2 represents others; for tumor stage, 0 represents stage I or II while 1 represents stages III and IV (B). Calibration plots of the nomogram for a 1-year, a 3-year, and a 5-year OS.

