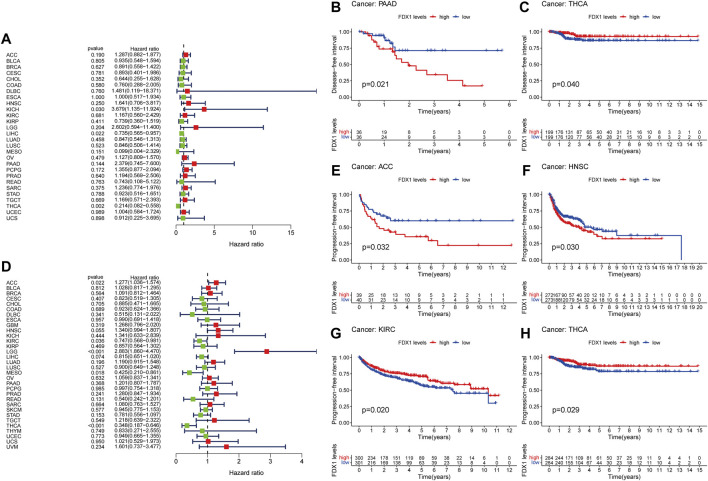
FIGURE 3.
Prognostic assessment of FDX1 expression in DFI and PFI. Correlation between FDX1 expression and DFI (A) and PFI (D) by utilizing Cox proportional hazards model (B,C) Kaplan-Meier analysis of DFI in patients with high and low FDX1 expression (E–H) Kaplan-Meier analysis of PFI in patients with high and low FDX1 expression. HR (hazard ratio) > 1 indicates that FDX1 may be an adverse factor in the occurrence and development of cancer, and it is shown in red; 0 < HR < 1 indicates that FDX1 may be a protective factor in cancer, and it is shown in green.

