
Figure 1. Nav1.8+ mouse DRG neurons and human DRG neurons express Antxr2.
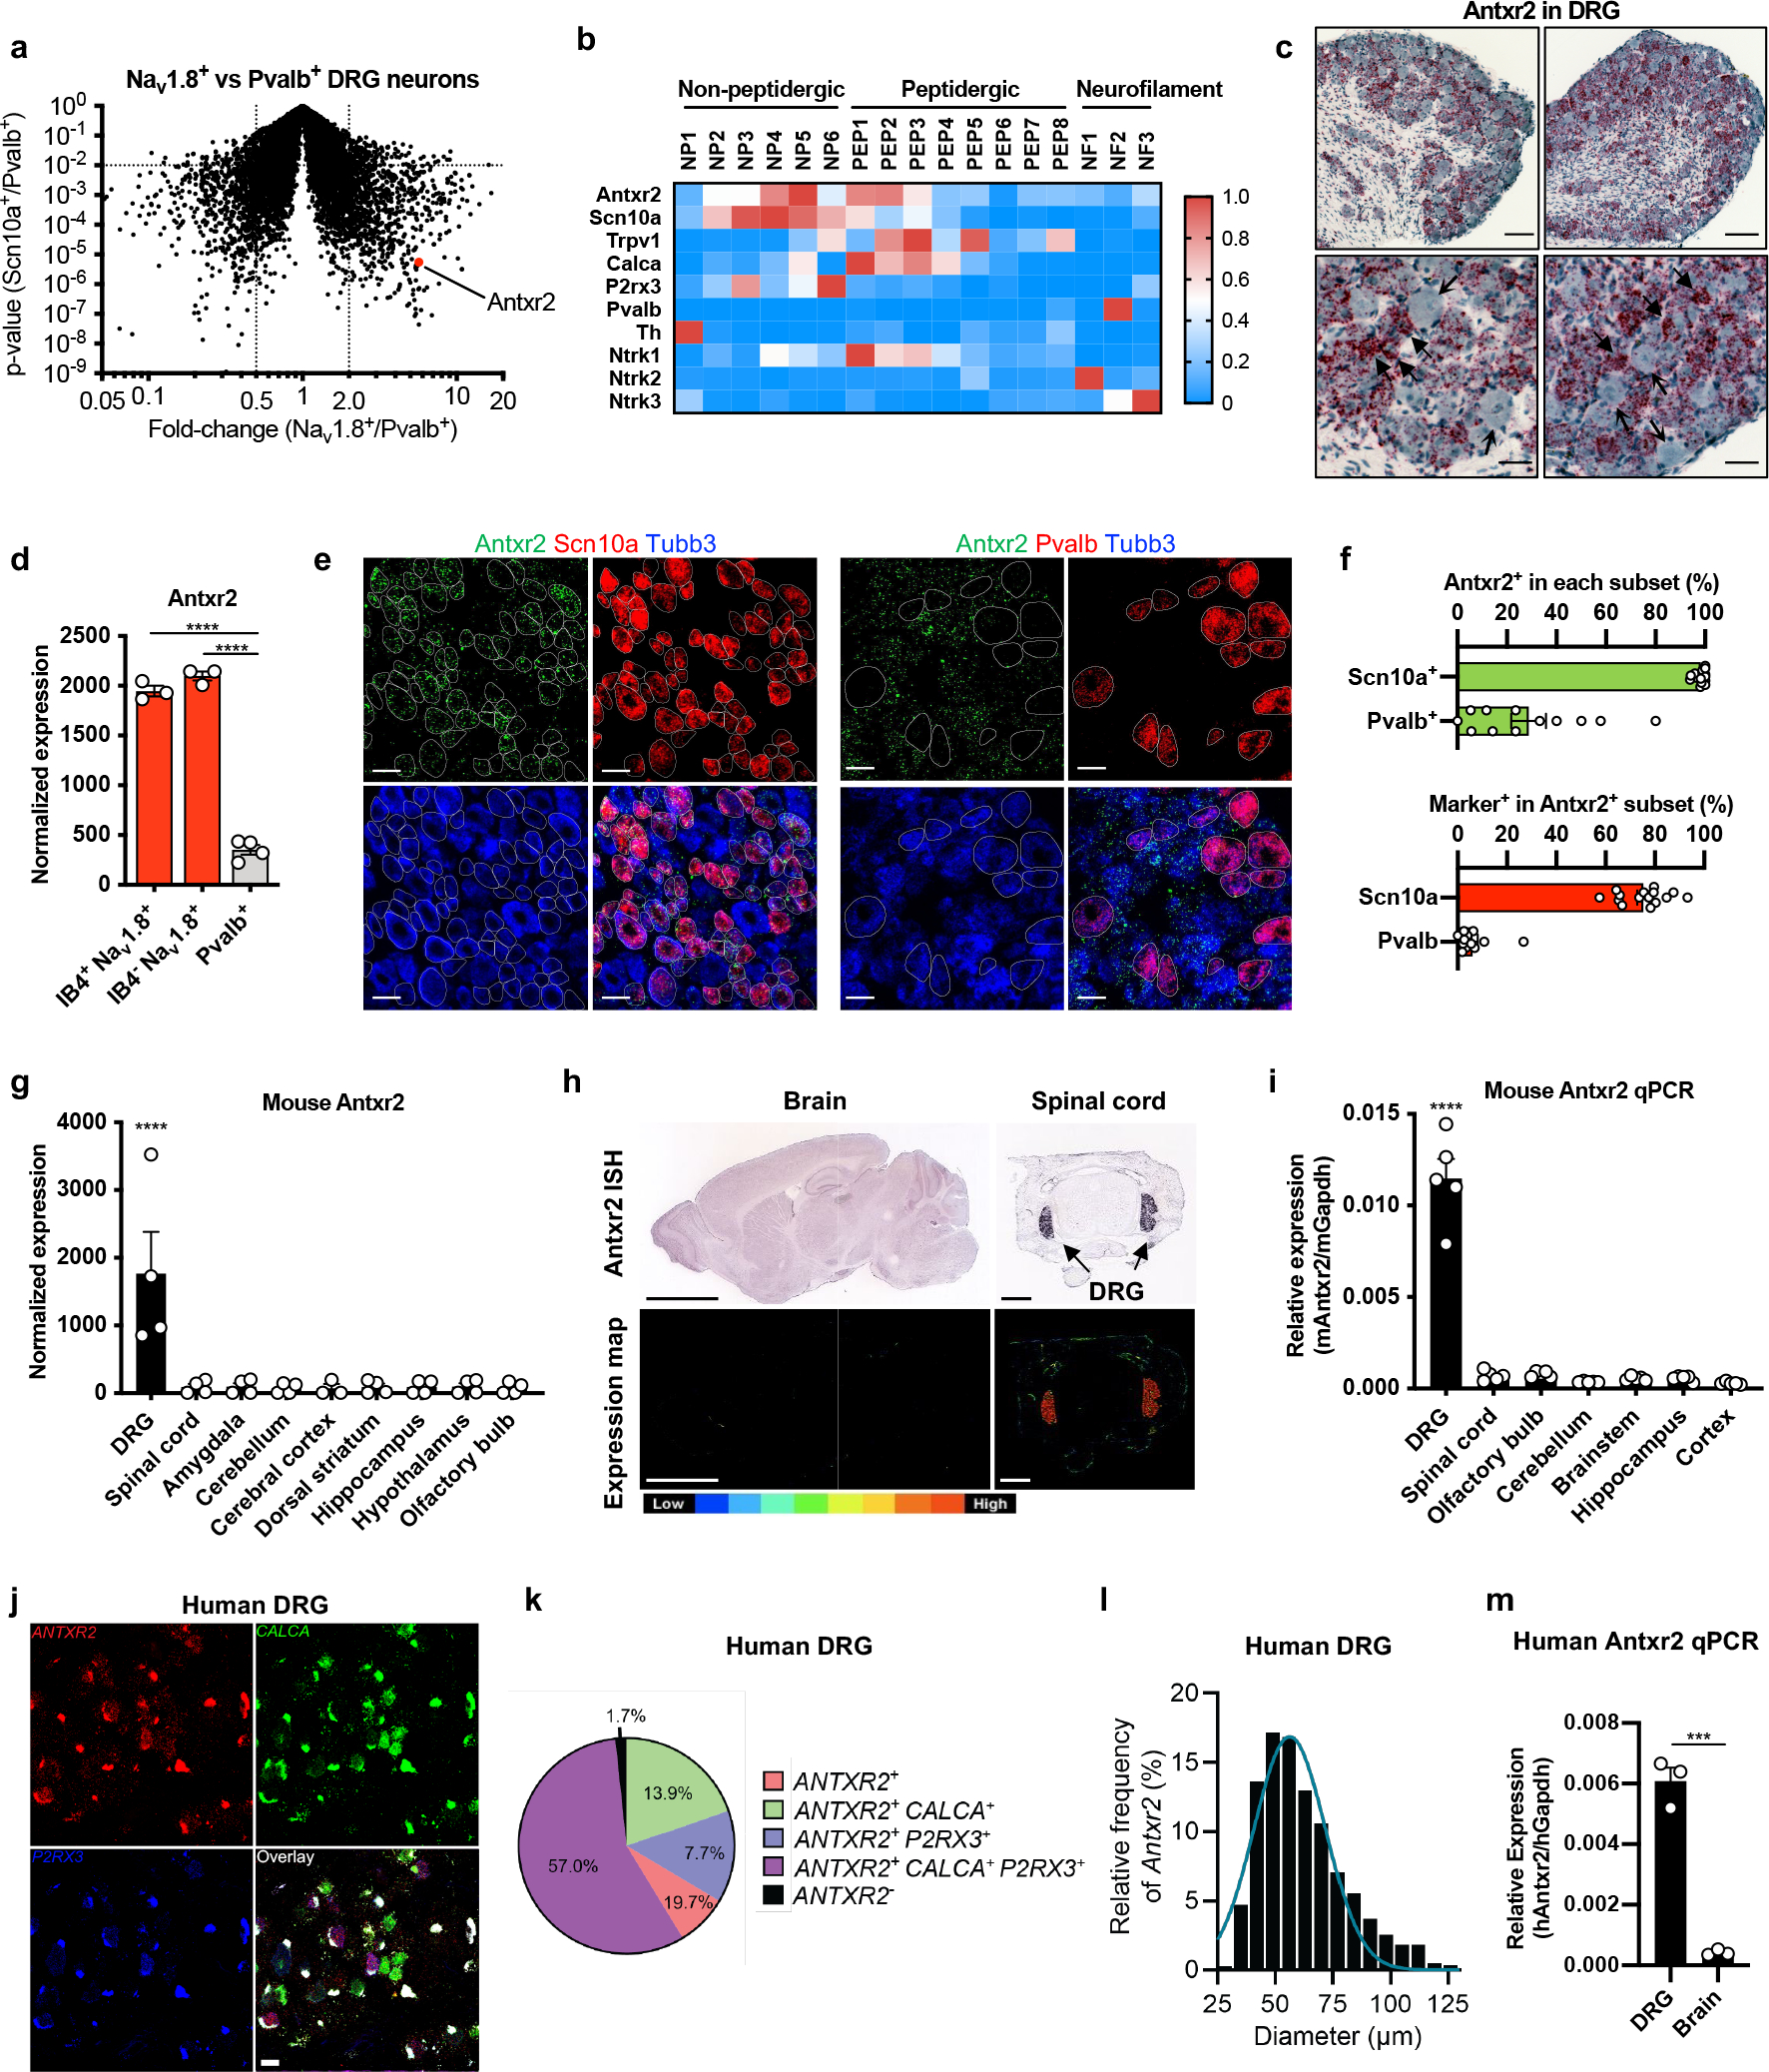
(a) Gene expression comparison of FACS-purified DRG neuron subsets3. Antxr2 is enriched in Nav1.8-lineage neurons by 5.7-fold (p=5.48×10⁻⁶).
(b) Expression of Antxr2 and subgroup markers across sensory neuron subsets from published RNA-seq data4.
(c) Representative images of in situ hybridization (ISH) analysis of Antxr2 in mouse DRG. Solid and open arrowheads point to neurons with high or low levels of Antxr2 transcripts, respectively. Scale bar, 100 μm (top row) or 35 μm (bottom row).
(d) Microarray analysis of Antxr2 expression in sorted DRG neuron subsets3 (n=3 mice for IB4+Nav1.8+ and IB4−Nav1.8+; n=4 mice for Pvalb+).
(e) Representative ISH images of Antxr2, Scn10a and Tubb3 (left) or Antxr2, Pvalb and Tubb3 (right) in mouse DRG. Scale bar, 40 μm.
(f) Expression of Antxr2, Scn10a and Pvalb were scored in all Tubb3+ neurons (n=15 fields for Scn10a analysis and n=12 fields for Pvalb analysis, both collected across 3 mice.)
(g) Antxr2 expression in mouse DRG and brain regions from public microarray data52–54 (n=4 samples).
(h) Antxr2 expression in adult (P56) brain and juvenile (P4) spinal cord from public ISH data55. Bottom row, color map of expression levels. Scale bar, 3000 μm (brain) or 400 μm (spinal cord).
(i) Quantitative PCR analysis of Antxr2 expression in mouse DRG and brain regions (n=5 mice).
(j) Representative ISH images of human DRG labeled for CALCA, P2RX3, ANTXR2 and DAPI. Lipofuscin that autofluoresced in all 3 channels and appear white in the overlay image is background signal present in all human nervous tissue.
(k) Distribution of ANTXR2 across neuronal subpopulations in human DRG (n=603 neurons from 3 donors).
(l) Size profile of all ANTXR2+ neurons in human DRG (n=594 neurons from 3 donors). Scale bar, 50 μm.
(m) Quantitative PCR analysis of ANTXR2 expression from human DRG RNA (pooled from 4 individuals) and total brain RNA (pooled from 21 individuals) (n=3 technical replicates).
Statistical significance was assessed by two-tailed t-test with unequal variances (a), one-way ANOVA with post hoc comparisons (d, g, i) or two-tailed unpaired t-test (m). ***p<0.001, ****p<0.0001. Data represent the mean ± s.e.m. For detailed statistical information, see Supplementary Table 2.