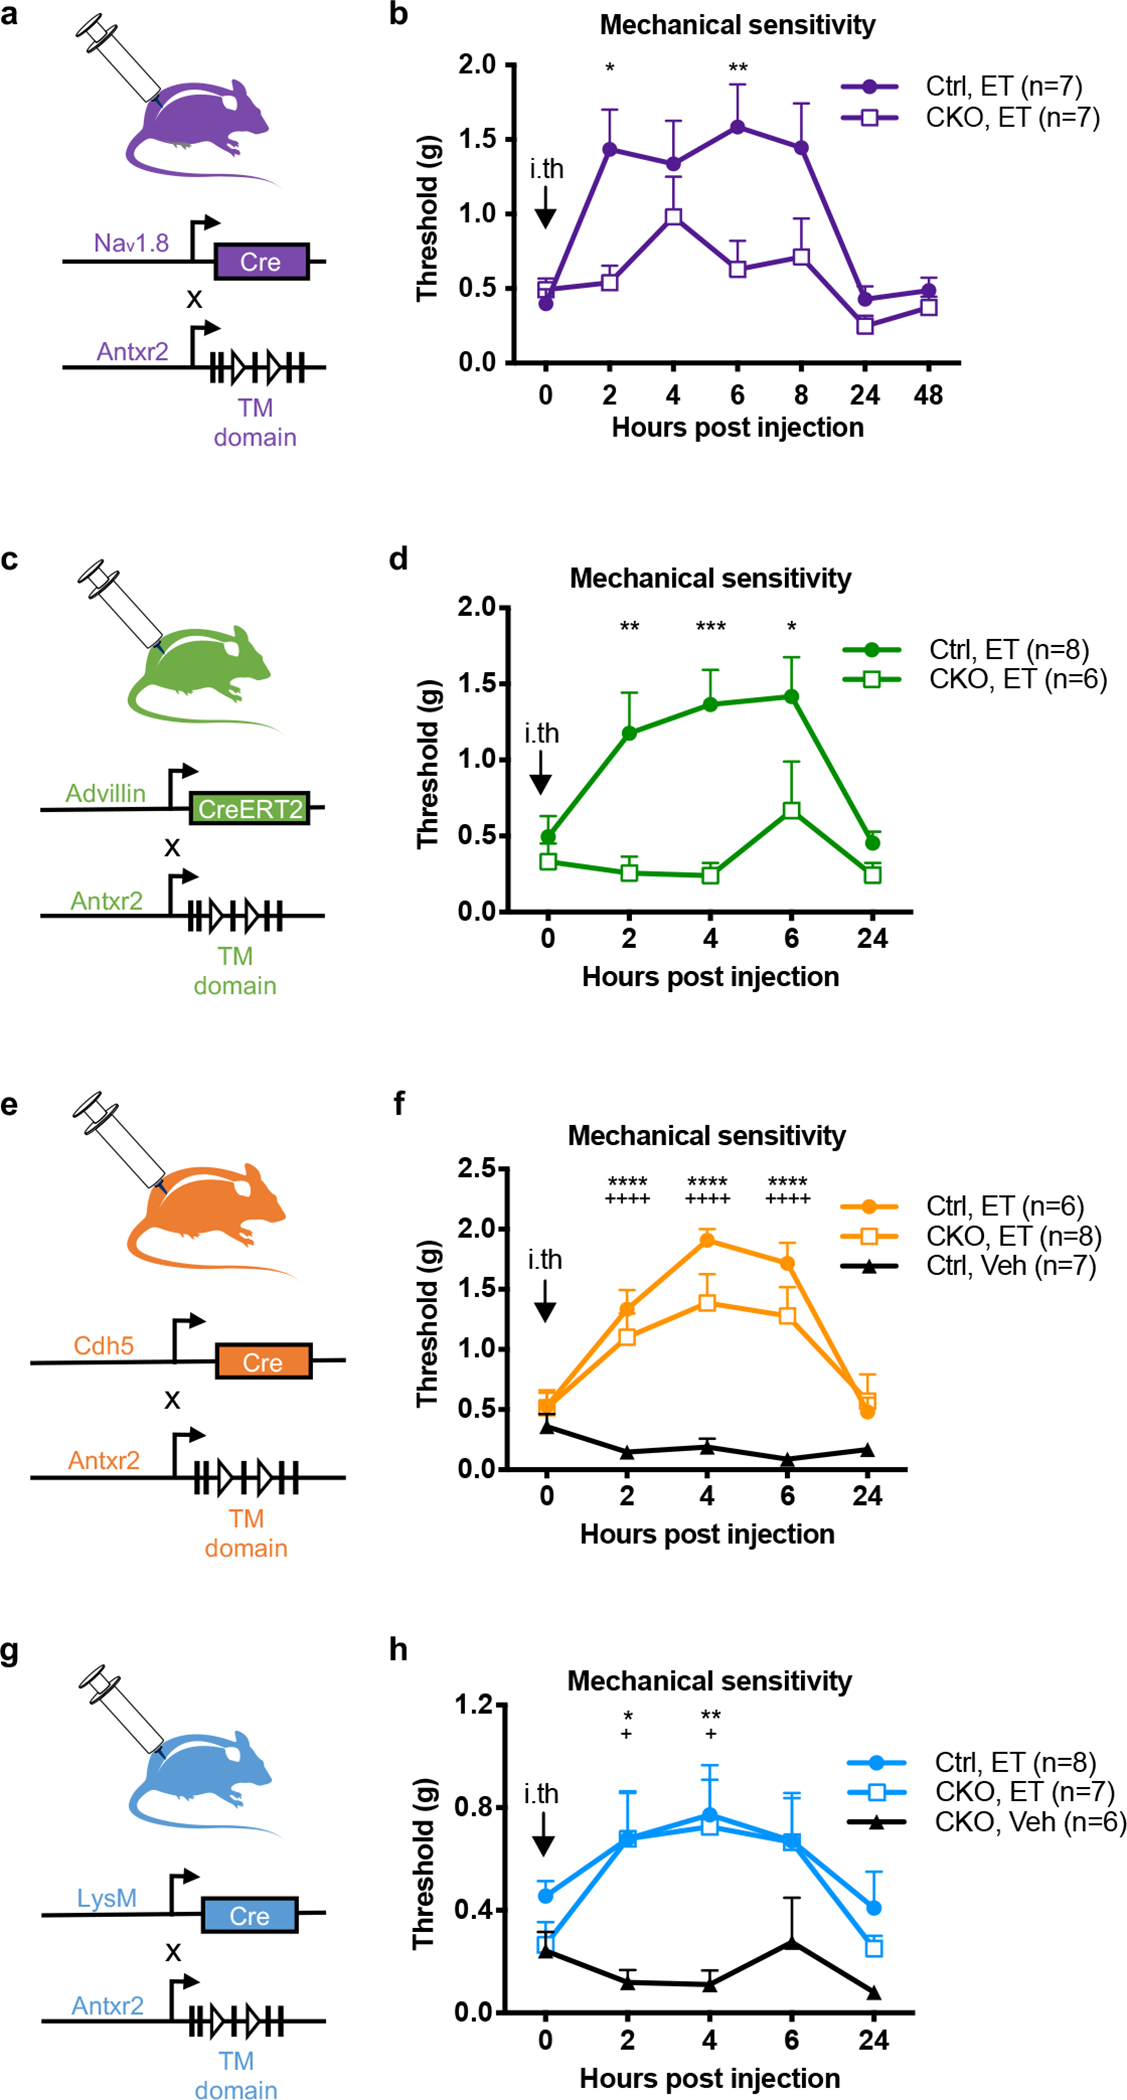
Figure 3. Antxr2 expressed by Nav1.8+ or Advillin+ neurons mediates ET-induced analgesia.

(a) Nav1.8-cre mice were bred with a conditionally targeted allele of Antxr2 in the transmembrane region (Antxr2fl/fl) to generate mice lacking Antxr2 function in Nav1.8 lineage nociceptors.
(b) Mechanical sensitivity thresholds in Nav1.8cre/+/Antxr2fl/fl mice (CKO; n=7 mice) or Nav1.8+/+/Antxr2fl/fl littermates (Ctrl; n=7 mice) injected intrathecally with ET (2 μg PA + 2 μg EF).
(c) Advillin-creERT2 mice were bred with Antxr2fl/fl mice to generate animals lacking Antxr2 function in all somatosensory neurons.
(d) Mechanical sensitivity thresholds in AdvcreERT2/+/Antxr2fl/fl mice (CKO; n=6 mice) or Adv+/+/Antxr2fl/fl littermates (Ctrl; n=8 mice) injected intrathecally with ET (2 μg PA + 2 μg EF). Antxr2 ablation was induced in adult mice by tamoxifen injection two weeks prior to the experiment.
(e) Cdh5-cre mice were bred with Antxr2fl/fl mice to generate animals lacking Antxr2 function in endothelial cells.
(f) Mechanical sensitivity thresholds in Cdh5cre/+/Antxr2fl/fl conditional KO mice (CKO) injected intrathecally with ET (2 μg PA + 2 μg EF; n=8 mice), or their Cdh5+/+/Antxr2fl/fl littermates (Ctrl) injected intrathecally with vehicle (PBS; n=7 mice) or ET (2 μg PA + 2 μg EF; n=6 mice). ‘*’ compares Ctrl, Veh vs. Ctrl, ET groups. ‘+’ compares Ctrl, Veh vs. CKO, ET groups.
(g) LysM-cre mice were bred with Antxr2fl/fl mice to generate animals lacking Antxr2 function in myeloid cells.
(h) Mechanical sensitivity thresholds in conditional KO mice (CKO; LysMcre/+/Antxr2fl/fl or LysMcre/cre/Antxr2fl/fl) injected intrathecally with vehicle (PBS; n=6 mice) or ET (2 μg PA + 2 μg EF; n=8 mice), or in control littermates (Ctrl; LysMcre/cre/Antxr2+/+, LysMcre/+/Antxr2+/+ or LysMcre/+/Antxr2fl/+) injected intrathecally with ET (2 μg PA + 2 μg EF; n=8 mice). ‘*’ compares CKO, Veh vs. Ctrl, ET groups. ‘+’ compares CKO, Veh vs. CKO, ET groups.
Statistical significance was assessed by two-way RM ANOVA with post hoc comparisons (b, d, f, h). *p<0.05, **p<0.01, ***p<0.001, ****p<0.0001, +p<0.05, ++++p<0.0001. Data represent the mean ± s.e.m. For detailed statistical information, see Supplementary Table 2.
