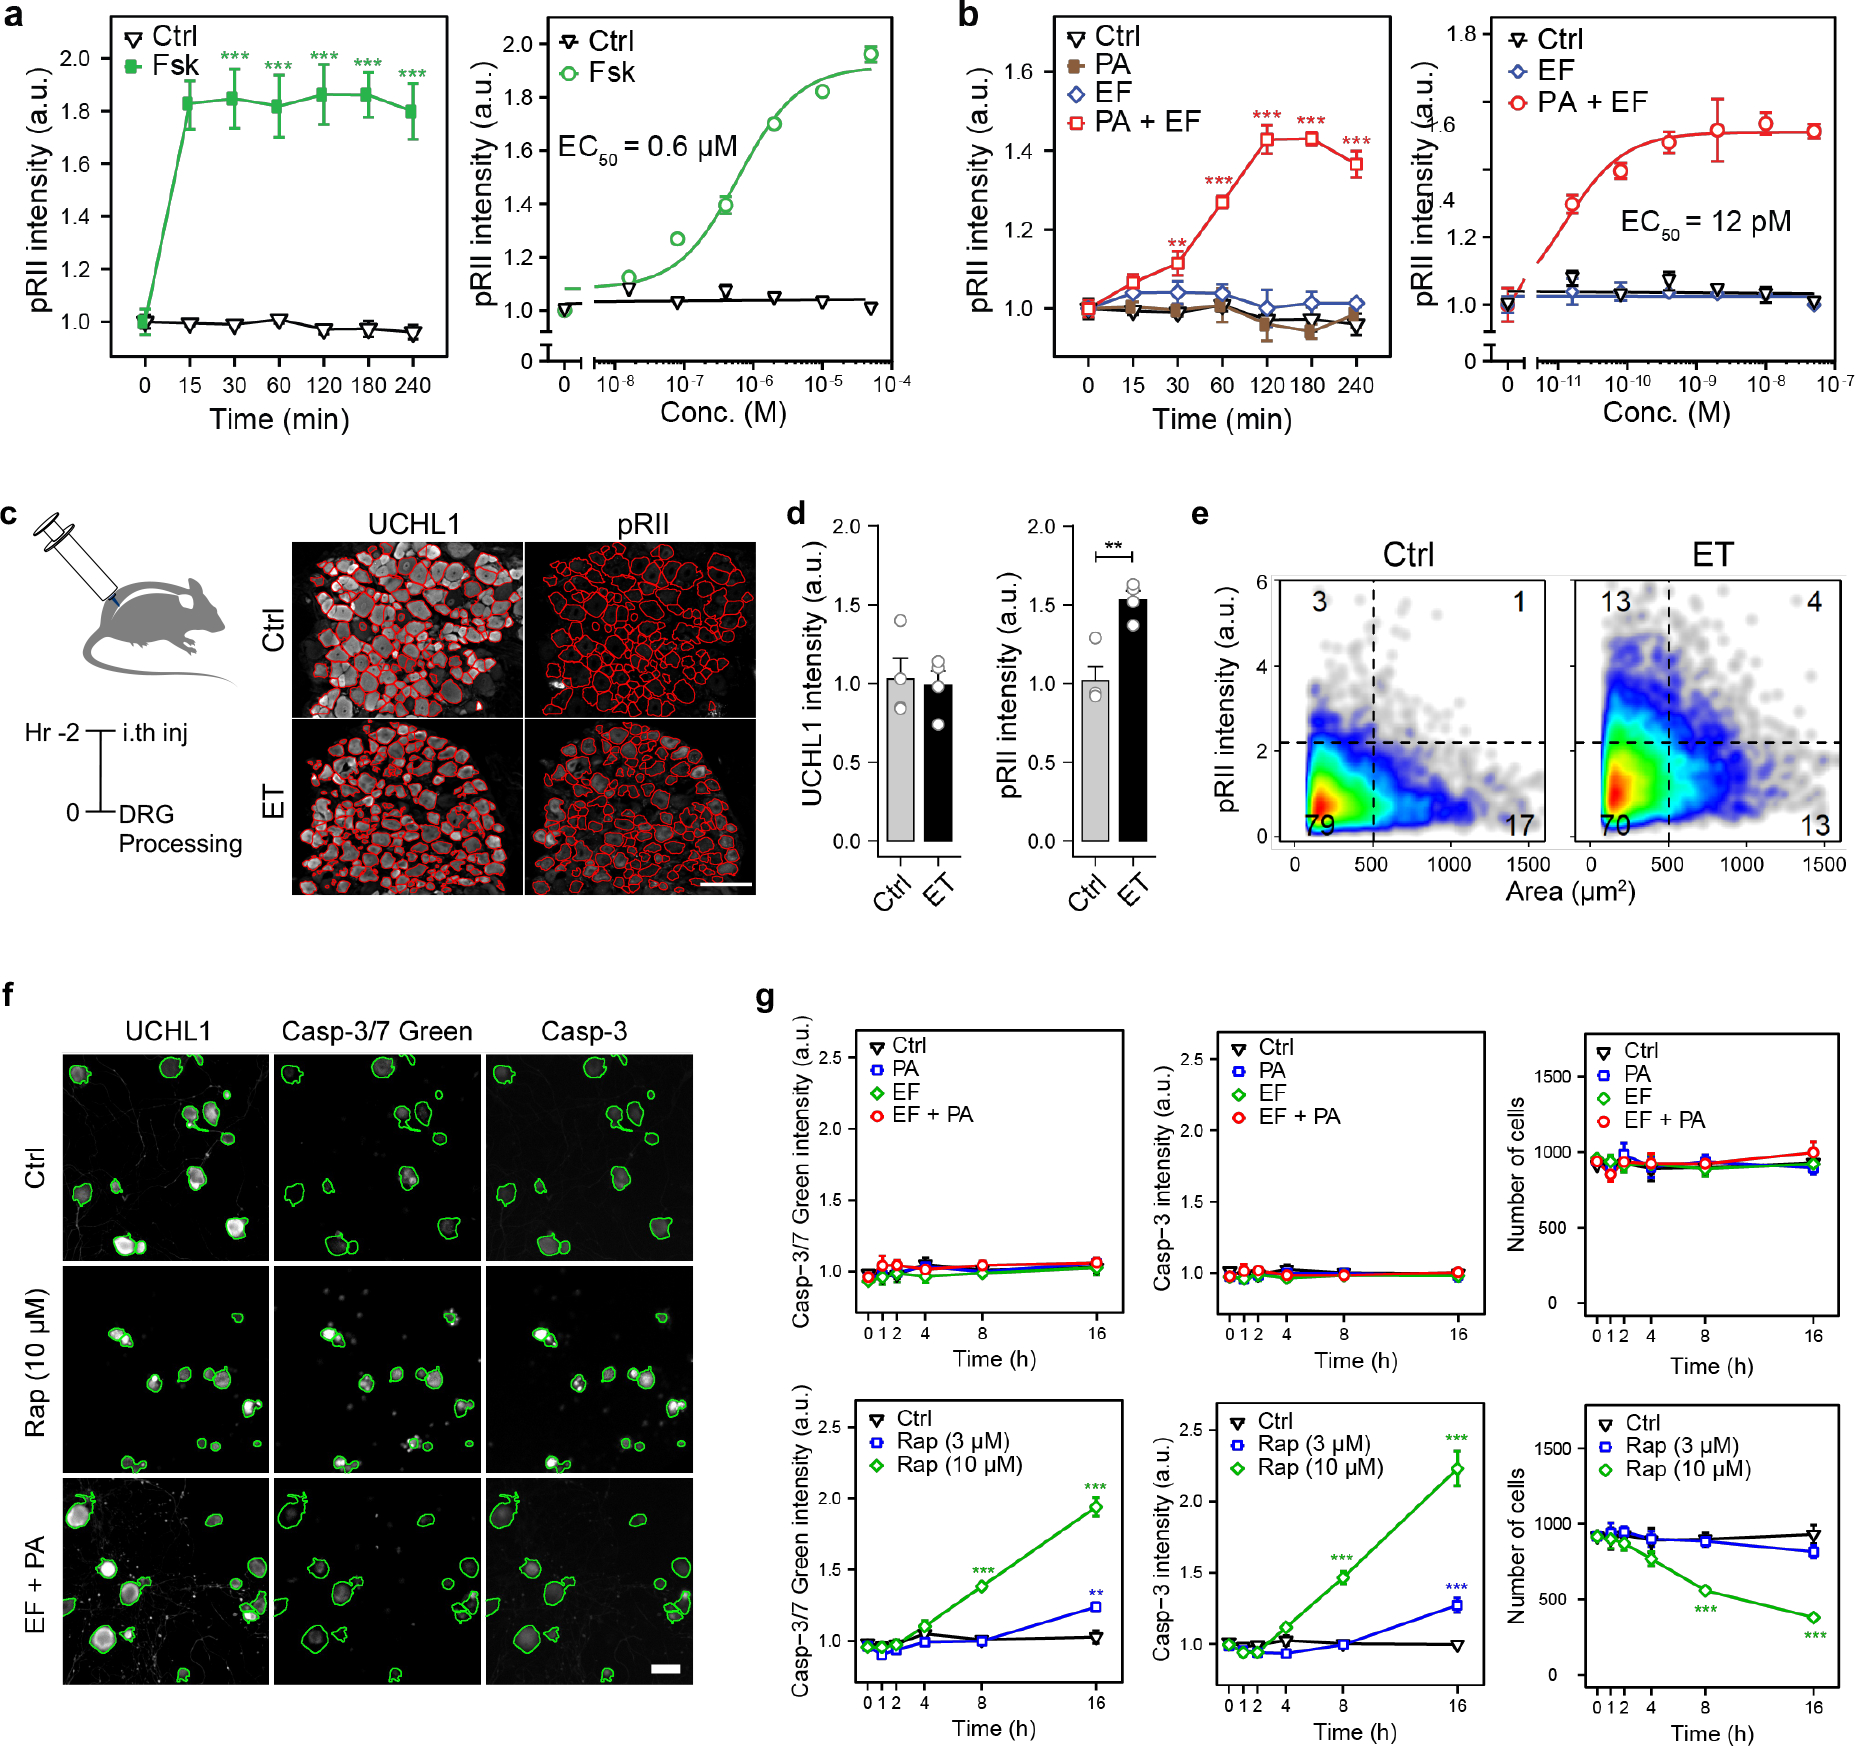
Figure 4. Edema Toxin induces PKA signaling in DRG neurons but does not affect neuronal viability.

(a) Time-course (left) and dose response (right) of pRII intensity in DRG neurons stimulated with forskolin (10 μM or 2 h) (n=3 experiments, >2500 neurons/condition).
(b) (Left) Time-course of pRII intensity in DRG neurons stimulated with Ctrl (0.1% BSA), PA (10 nM), EF (10 nM) or the combination of both factors. (Right) Dose-response curve of pRII intensity in DRG neurons stimulated with EF (0 – 50 nM, 2 h) in the presence of a constant concentration of PA (10 nM) (n=3 experiments, >2500 neurons/condition).
(c) Representative images of frozen L3 - L6 DRG sections obtained from mice 2 h post intrathecal injection of vehicle (PBS) or ET (2 μg PA + 2 μg EF). The red lines indicate the mask used to quantify signal intensities in DRG neurons. Scale bar, 100 μm.
(d) Mean UCHL1 and pRII intensities quantified in DRG sections of the respective mice (n=4 mice/group, 15 – 20 images of 4 non-consecutive sections/animal, 1951 ± 279 neurons/animal).
(e) Single cell data of the quantified DRG neurons.
(f) Representative images of mouse DRG neurons stimulated with solvent control (Ctrl), raptinal (Rap; 3 or 10 μM) or ET (10 nM PA + 10 nM EF) for 16 h. Cultures were stained for UCHL1, caspase-3/7 green detection reagent, and cleaved caspase 3. The cells were fixed about 1 hour after adding the caspase-3/7 dye, stained with a standard ICC protocol, and analyzed by HCS microscopy. Green encircled neurons indicate automatically selected objects, respectively (see Methods section). Scale bar, 50 μm.
(g) Time-course of caspase-3/7 green detection reagent, cleaved caspase 3 intensity and corresponding cell numbers per analyzed well (n=4 experiments).
Statistical significance was assessed by two-way ANOVA with Bonferroni’s post hoc test (a, b, g) or two-tailed unpaired t-test (d). **p<0.01, ***p<0.001. Data represent the mean ± s.e.m. For detailed statistical information, see Supplementary Table 2.
