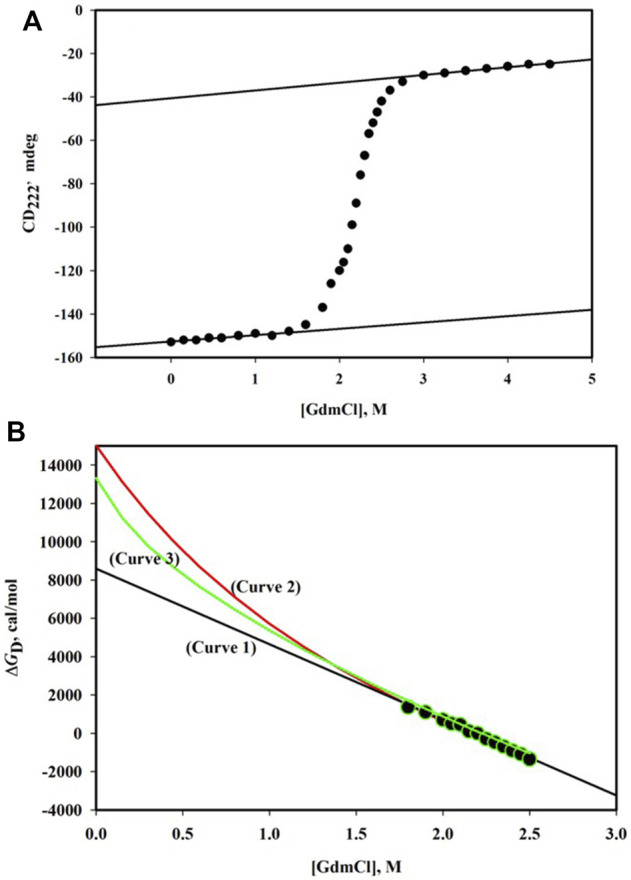
FIGURE 1.

(A) GdmCl-induced denaturation curve monitored by CD222 of α-phycoerythrin at pH 7.0 and 25°C. The protein concentration was 0.75 mg/ml and path length of the cell was 0.1 cm. The linear dependence of the pre-transition baseline is described by the relation, CD222 = -152.6 + 2.90 [GdmCl]. The linear dependence of the post-transition baseline is described by the relation, CD222 = -40.5 + 3.57 [GdmCl]. (B) Plot of ΔG D versus [GdmCl]. Observed data (filled circles) were analyzed using three models of denaturation (see text). The best fit parameters are as follows: ΔG D 0 = 8.58 (±0.20) kcal/mole and m = 3.94 (±0.09) kcal/mole. M for the linear model (curve 1); ΔG D 0 = 15.03 (±0.46) kcal/mole, Δn = 48 (±1), and k = 0.7 for the binding model (curve 2); and ΔG D 0 = 12.90 (±0.14) kcal/mole and Δα = 0.31 (±0.01) for the transfer-free energy model.
