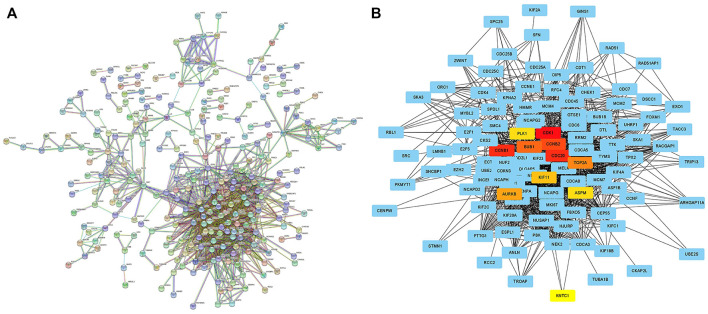
FIGURE 11.
Searching network core genes by PPI analysis (A) PPI analysis of differentially expressed genes between different risk groups was performed on STRING online website (high confidence = 0.9); (B) The PPI analysis results were imported into Cytoscape software to search for network core genes, which were marked in non-blue.

