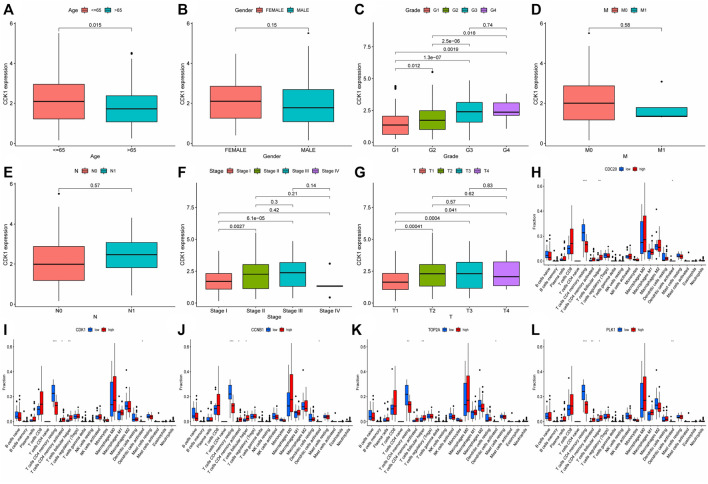
FIGURE 13.
Analysis of clinical and immune correlation of core network genes (A–G) Clinical correlation analysis was performed on 10 core network genes, including gender, age, TNM stage, Stage and Grade (CDK1 analysis was shown only, other result could be seen in supplementary documents (Data Sheet 1); (H–L) Immunocyte infiltration of 10 core genes in the network was analyzed (only the results of the first five genes were shown, other result could be seen in supplementary documents (Data Sheet 2). * represented p < 0.05, ** represented p < 0.01, *** represented p < 0.001.

