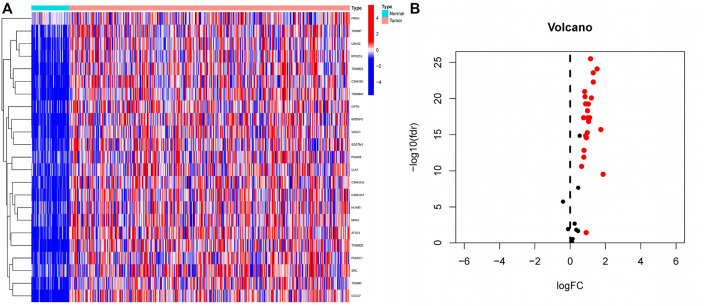
FIGURE 2.
Extraction of differentially expressed mitophagy-related genes (A) A total of 23 genes related to mitophagy were differentially expressed between HCC tissues and normal tissues. In the heatmap, the front half of the transverse axis represented normal tissue, and the latter half represented tumor tissue. Red mean high gene expression, blue mean low gene expression; (B) Volcanic map of the expression of thirty-four MRGs in HCC tissues. The expression of red genes was up-regulated in HCC tissues, and the expression of black genes was not significantly changed in HCC tissues.

