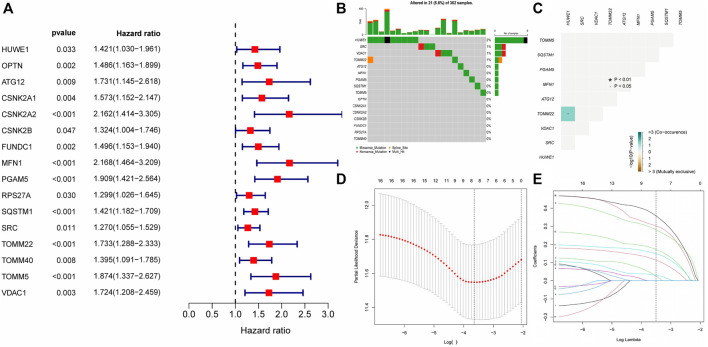
FIGURE 3.
Gene mutation analysis and establishment of prognostic model (A) The result of Single factor COX regression The inclusion criteria were that the p value was less than 0.05 and the HR confidence interval did not include 1; (B) Waterfall map of gene mutation. (C) Co-mutation of 16 prognostic-related genes. Green represented that the mutation of one gene would promote the mutation of another gene. Brown indicated that one gene mutation inhibits another gene mutation; (D–E) The LASSON regression punished all variables. The coordinates at the lowest point of the red line in Figure D were the penalty values. A dotted line was drawn at the corresponding penalty value in Figure F, and all the independent variables that had great influence on the dependent variables were selected (each curve represents the change trajectory of each independent variable coefficient).

