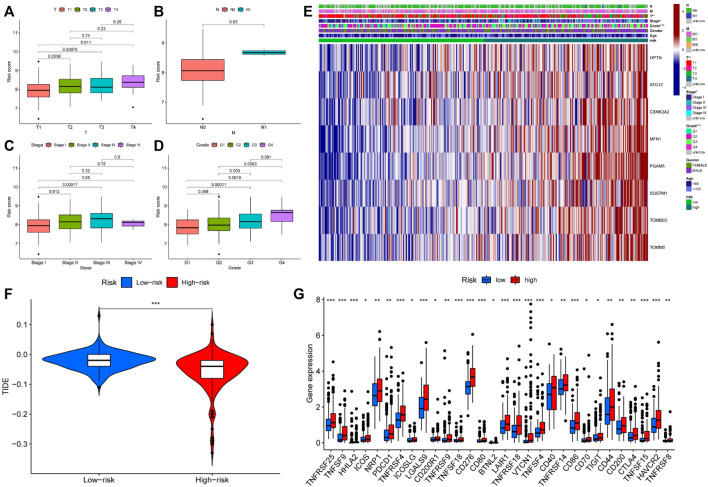
FIGURE 6.
Differences in clinical features and efficacy of immunotherapy among patients with different risk scores (A–D) Risk score was correlated with T, N, Stage and Grade; (E) The expression of prognostic related genes in clinical factors and different risk groups; (F) The violin chart of patients’ response to immunotherapy in high and low-risk groups. Blue represented low-risk group, red represented high-risk group; (G) Expression of immune checkpoints in two risk subgroups. * represented p < 0.05, ** represented p < 0.01, and *** P represented <0.001.

