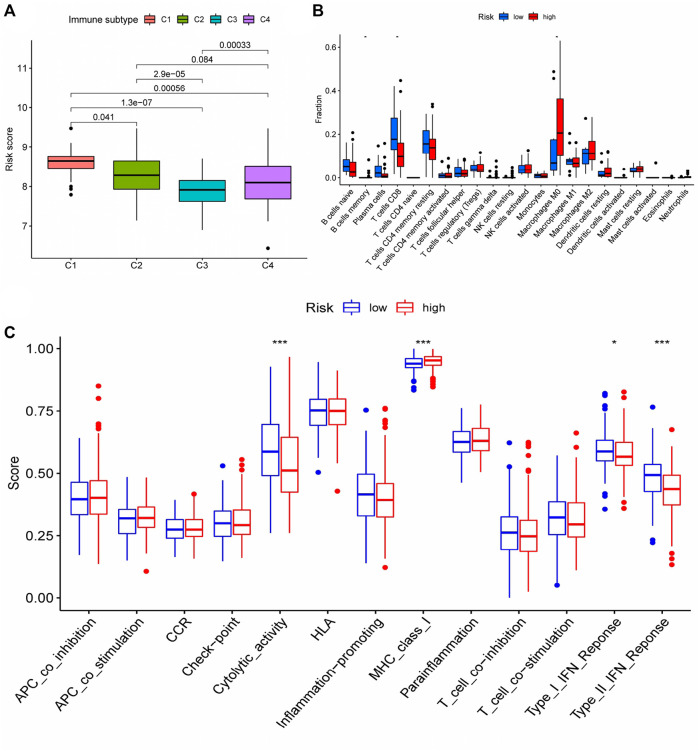
FIGURE 8.
Differences in immune status among patients with different risk scores (A) Cluster analysis was performed on the immune cells infiltrated by HCC tissues in patients with different risk groups. (B) The number of CD8 + T cells in HCC tissues of patients in the high-risk group was significantly decreased, and the number of M0 macrophages was significantly increased (memory B cells were not discussed due to too few cells); (C) Changes of immune function in patients with high-risk group. * represented p < 0.05, *** represented p < 0.001.

