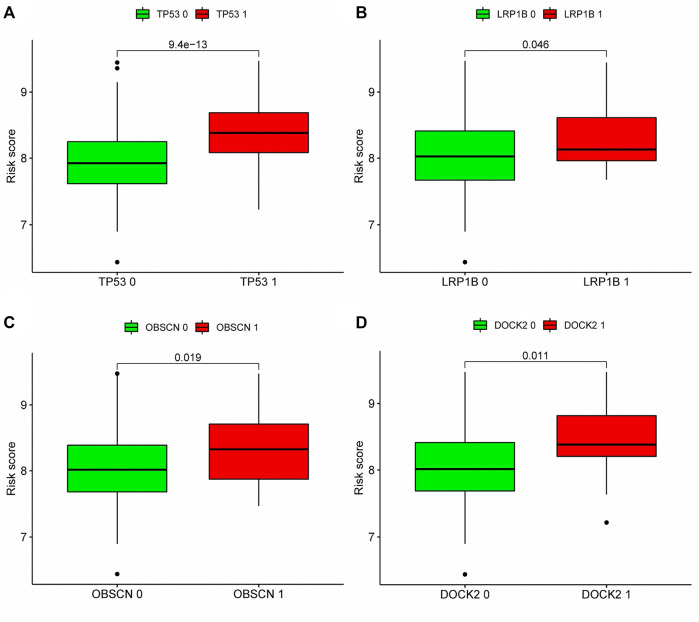
FIGURE 9.
Correlation analysis between top 20 mutation genes and risk score: According to the expression level of mutant genes, patients in the TCGA cohort were divided into high-expression group and low-expression group, and whether there was difference in the risk score between the two groups was compared. (A–D) Analyze whether the top 20 genes with the highest mutation frequency are associated with the risk score. Patients with high expression of TP53, LRP1B, OBSCN and DOCK2 had higher risk scores. Green meant low expression of this gene, red meant high expression of this gene. 0: No mutation, 1: mutation.

