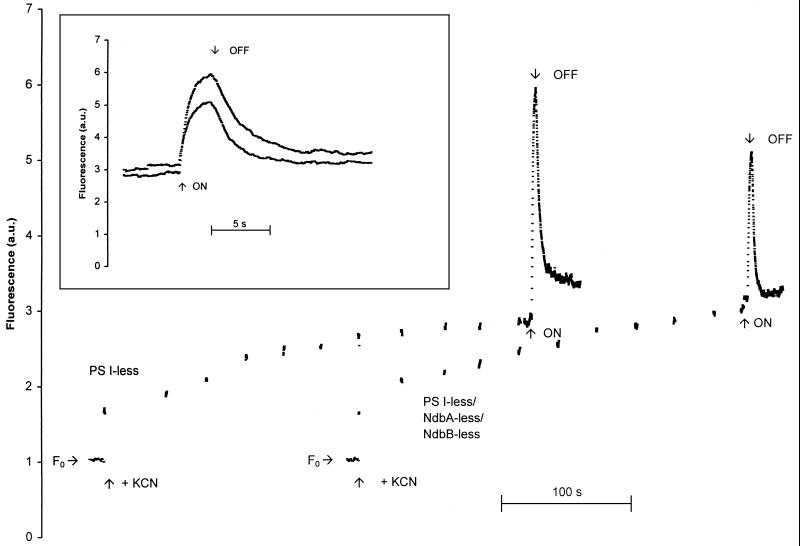
FIG. 4.
Monitoring of variable fluorescence in darkness in the PS I-less strain and the PS I-less-, NdbA-less-, and NdbB-less strain. Cells were harvested in mid-exponential growth phase and concentrated to a chlorophyll concentration of 2 μg ml−1 in 10 mM HEPES–NaOH (pH 7.4). KCN was added to a final concentration of 5 mM where indicated. The time points at which high-intensity actinic light (150 microeinsteins m−2s−1) was turned on and off have been indicated as well. The inset is an enlargement of the trace when Fmax and the subsequent decay of chlorophyll fluorescence were monitored during and after actinic illumination. The traces have been normalized to F0. The traces have been offset in the x direction in the main graph but not in the inset. a.u., arbitrary units.

