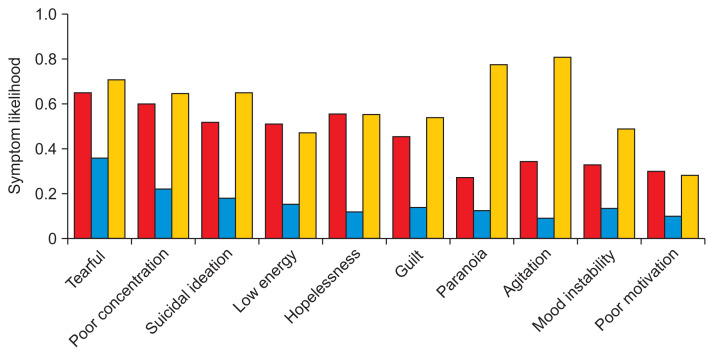
Figure 2.
Three-class latent class analysis (LCA) symptom likelihoods. Column colors represent individual subtypes. The top 10 most common symptoms in the dataset were included here. The red and yellow columns can be viewed as severe subtypes, where the latter is distinguished by psychotic features. The blue, overall, forms a mild subtype.

