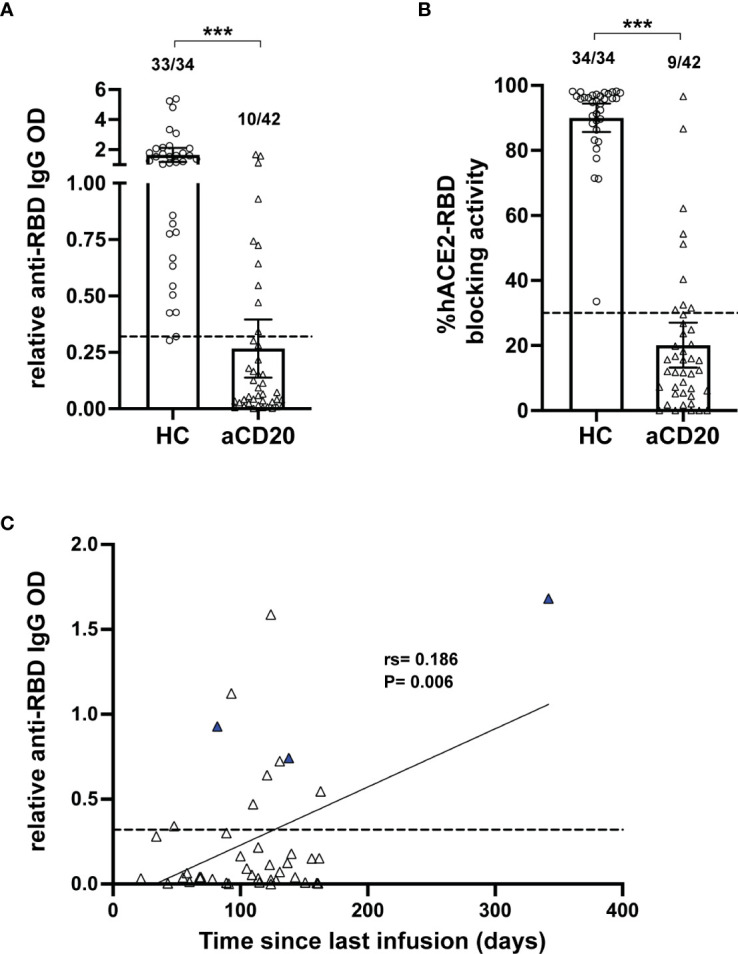
Figure 1.

Deficient humoral response in aCD20-MS compared to healthy controls. (A-C) Humoral response analysis performed with serum samples collected within 6 months after vaccination of healthy controls (open circles, n=34) and aCD20-MS patients (open triangles, n=42). Dots represent individual data points. (A) Comparison of anti-spike RBD IgG antibody titers from serum samples of healthy controls and aCD20-MS patients expressed as relative OD values. Box plots represent mean and 95% CI. Dotted line indicates limit of sensitivity (0.32) and represents mean + S.D. positivity cut-off obtained from unexposed individuals (n=51). Fractions of samples above limit of sensitivity are indicated on top of each dataset. ***P < 0.001; Mann-Whitney U tests. (B) Antibody-induced blocking activity of hACE2 binding to RBD was determined from serum samples using the SARS-CoV-2 Surrogate Virus Neutralization Test cPass™ kit (GenScript) and expressed as % hACE2-RBD blocking activity. A percentage of 30% was used to determine positive RBD-hACE2 inhibition. Fractions of samples above positivity threshold are indicated on top of each dataset. ***P < 0.001; Mann-Whitney U tests. (C) Linear regression of the ratio of relative anti-RBD IgG OD value and time between last anti-CD20 infusion therapy and first vaccination dose of aCD20-MS patients showing significant correlation between IgG titers and time post-last infusion. Blue triangles represent patients with B-cell counts higher than 20 cells per µL. Dotted line indicates limit of sensitivity.
