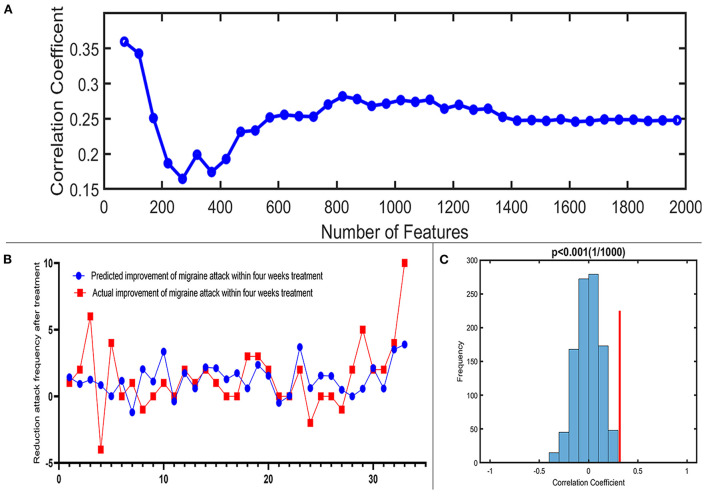
Figure 4.
Prediction performance of the proposed approach. (A) Line chart reflecting actual label and predictive label; when including 70 predictive features, the highest correlation coefficient is 0.36. (B) Correlation coefficient between the actual label and predictive label with the increased number of features in the reduction of migraine attack frequency. (C) The result of the permutation test with the highest correlation coefficient (p < 0.001).

