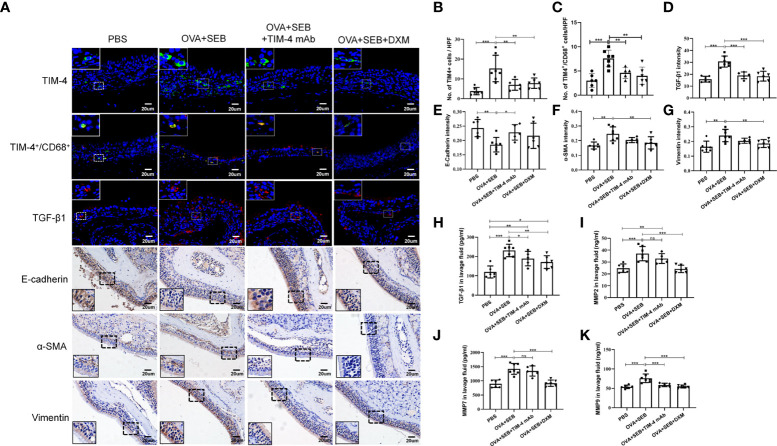
Figure 4.
TIM-4 interference inhibits the EMT process in the NP model. (A) TIM-4+ cells (green), TIM-4+/CD68+ cells (yellow), and TGF-β1 (red) in the mouse sinonasal mucosa were detected by immunofluorescence. E-cadherin, α-SMA, and Vimentin in the mouse sinonasal mucosa were detected by IHC. (B) Quantitative summary of the number of TIM-4+ cells in the mouse sinonasal mucosa. (C) Quantitative summary of the number of TIM-4+/CD68+ cells in the mouse sinonasal mucosa. (D) Quantitative summary of the intensity of TGF-β1 in the mouse sinonasal mucosa. (E) Quantitative summary of the intensity of E-cadherin in the mouse sinonasal mucosa. (F) Quantitative summary of the intensity of α-SMA in the mouse sinonasal mucosa. (G) Quantitative summary of the intensity of Vimentin in the mouse sinonasal mucosa. (H-K) The TGF-β1, MMP2, MMP7, and MMP9 levels in the nasal lavage fluid were detected by ELISA. PBS group: n=6; OVA+SEB group: n=7; OVA+SEB+TIM-4 mAb group: n=5; OVA+SEB+DXM group: n=6. IHC and immunofluorescence representative pictures are shown at a magnification of 400×. The insets show a higher magnification of the selected area. Bars show the mean ± SD. *P<0.05, **P<0.01,***P<0.001. ns, no significance.

