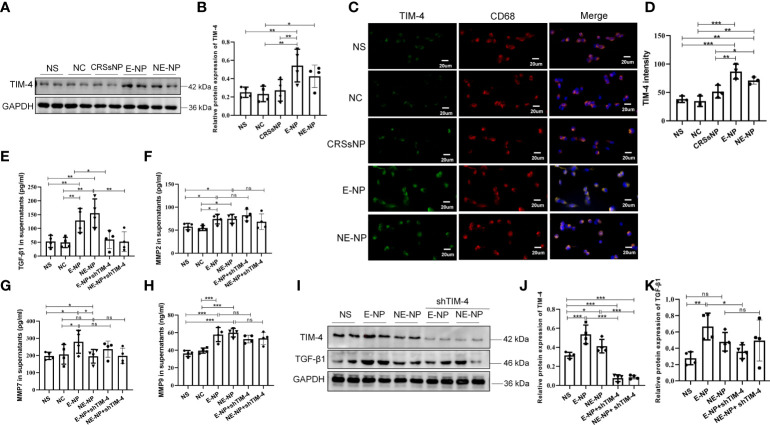
Figure 6.
Tissue extracts promote the expression of TIM-4, TGF-β1, MMP2, MMP7, and MMP9 in macrophages. (A) TIM-4 protein expression in THP-1 cells treated with nasal tissue extracts from healthy subjects (NC group) and patients with CRSsNP, E-CRSwNP (E-NP group), and NE-CRSwNP (E-NP group) for 24 h was measured by Western blot analysis. For each group, n=4. (B) Quantitative summary of the relative protein expression of TIM-4. (C) TIM-4 expression in THP-1 cells treated with nasal tissue extracts from NC, CRSsNP, E-NP, and NE-CRSwNP groups for 24 h was measured by immunofluorescence. Images show representative immunostaining for TIM-4 (green) and CD68+ macrophages (red). For each group, n=3. (D) Quantitative summary of the intensity of TIM-4 in THP-1 cells. (E-H) The TGF-β1, MMP2, MMP7, and MMP9 levels in THP-1 cell supernatants after treatment with nasal tissue extracts from healthy people NC, CRSsNP, E-NP, and NE-CRSwNP groups for 24 h were detected by ELISA. For each group, n=4. (I) The protein levels of TIM-4 and TGF-β1 in THP-1 cells were measured by Western blot analysis after treatment with nasal tissue extracts and TIM-4 interference, and the intensity values of the bands were normalized to GAPDH expression. For each group: n=4. (J) Quantitative summary of the relative protein expression of TIM-4. (K) Quantitative summary of the relative protein expression of TGF-β1. Representative immunofluorescence images are shown at 400× magnification. Bars show the mean ± SD. *P<0.05, **P<0.01,***P<0.001. ns, no significance.

