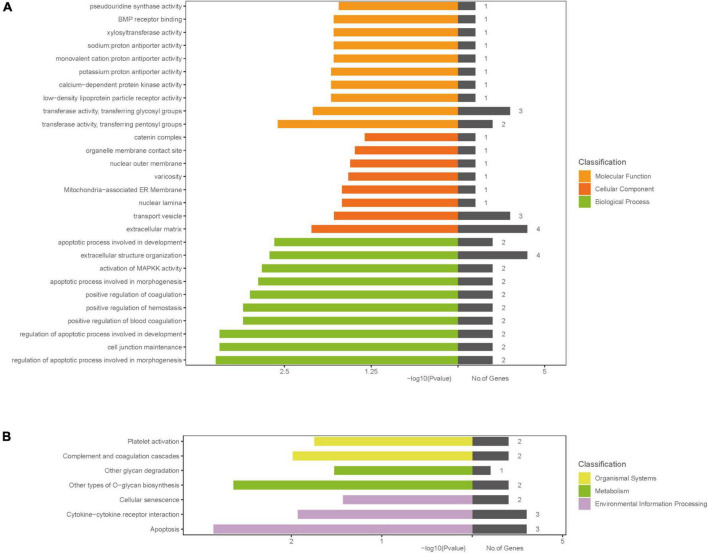
FIGURE 3.
Gene ontology and KEGG enrichment analysis. (A) GO enrichment result of DEGs; (B) the results of KEGG signaling pathway enrichment analysis; The x-axis label represents P-value and the number of genes and the y-axis label represents GO and KEGG terms, different colors represent different classification. DEGs, differentially expressed genes; GO, gene ontology; KEGG, Kyoto Encyclopedia of Genes and Genomes pathway.

