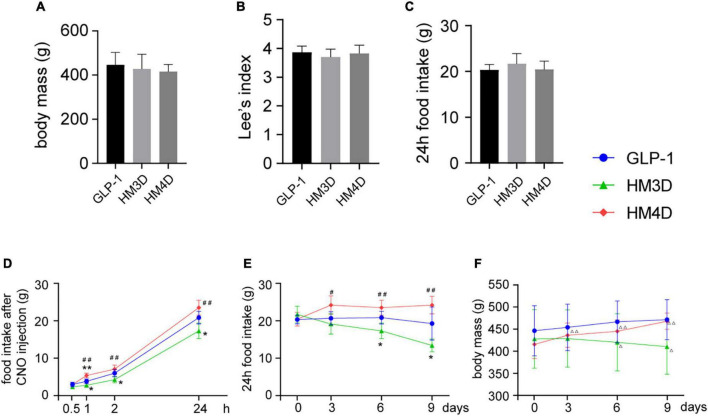
FIGURE 5.
Appetite-related behavioral changes in each group. (A–C) Baseline of body mass, lee’s index, and 24 h food intake of rats in each group, which were collected at day 0; (D) cumulative food intake of rats in each group at different time points after the first CNO injection; (E) changes in 24 h food intake of rats in each group after CNO injection during the intervention period; (F) changes in body mass of rats in each group during the intervention period; vs. GLP-1 group, *P < 0.05, **P < 0.01; vs. HM3D group, #P < 0.05, ##P < 0.01; vs. day 0, △ P < 0.05, △ △ P < 0.01. CNO, Clozapine-N-oxide.

