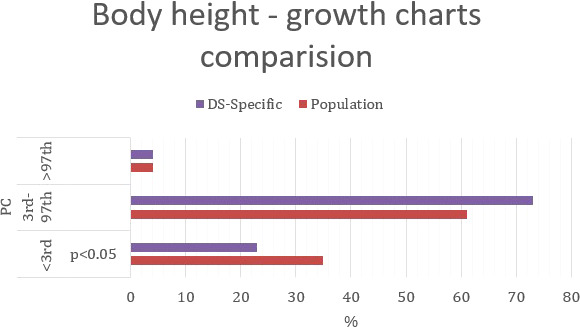
Figure 4.

Percentage comparison of the number of individuals qualified for the given BMI categories on the standard growth charts and DS-specialized growth charts.

Percentage comparison of the number of individuals qualified for the given BMI categories on the standard growth charts and DS-specialized growth charts.