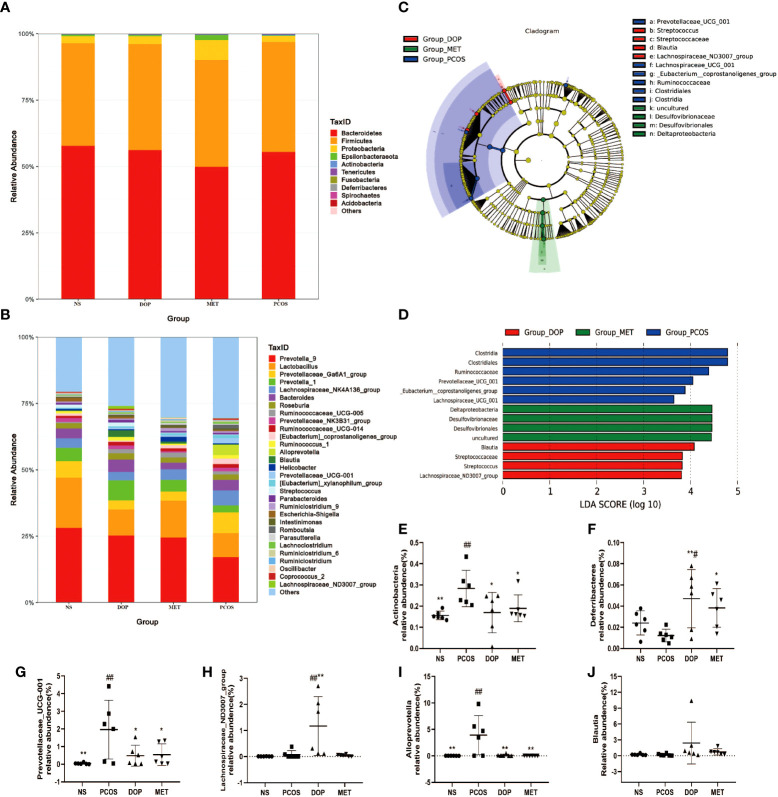
Figure 7.
Effect of DOP treatment on gut microbial composition, n = 6. (A) Microbial distribution at the phylum level. (B) Microbial distribution of the top 30-genus level. (C) Cladograms representing the linear discriminant analysis effect size (LEfSe) results. (D) Linear discriminant analysis (LDA) results between different experimental groups. LDA scores above 3.00 and p < 0.05 are shown. (E-J) Relative abundance of Actinobacteria, Deferribacteres, Prevotellaceae_UCG_001, Lachospiraceae_ND3007_group, Alloprevotella, and Blautia between all groups. Note: compared with the PCOS group: * p < 0.05, ** p < 0.01; compared with the NS group: # p < 0.05, ## p < 0.01.

