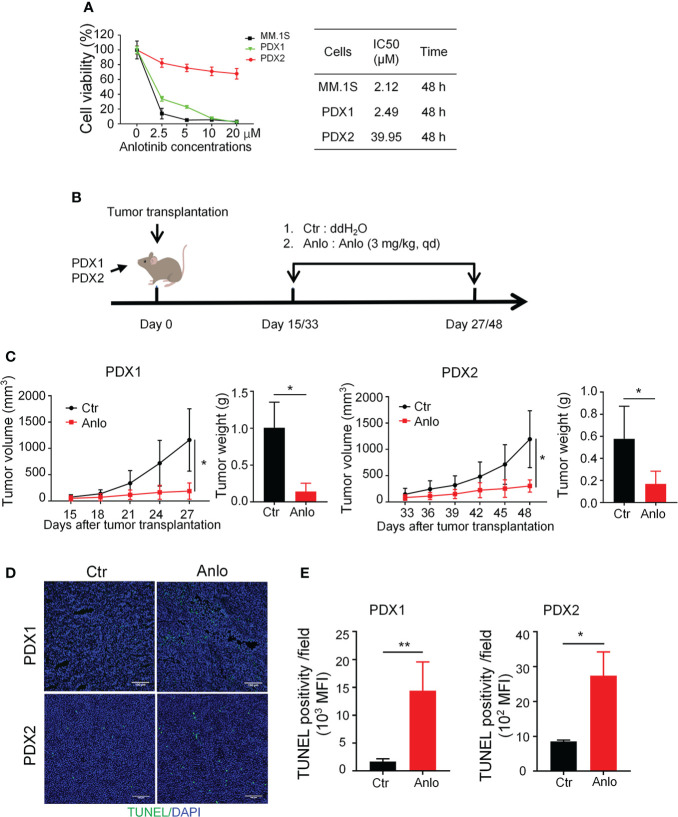
Figure 4.
Anlotinib therapy significantly suppressed the growth of myeloma PDXs and induce cell apoptosis even in the bortezomib-resistant model. (A) Single-cell suspensions of tumor tissues from PDX1 and PDX2 were prepared. CD138+ myeloma cells were purified from the single-cell suspension of PDXs by Human CD138 MicroBeads. MM.1S and CD138+ myeloma cells from PDX1 and PDX2 were treated with anlotinib (0-20 μM) for 48 h, and the cell viability was analyzed by CCK8 assays. Each experiment was performed in triplicate. The IC50 was calculated based on the dose-response curve using SPSS version 23 software. (B) Experimental design: NDG mice were subcutaneously implanted with tumor pieces (1-2 mm3) of PDXs on the flank. When tumors reached 4-6 mm in diameter, mice were randomly divided into two groups.The anlotinib group (n=5-6 every group) was administered intragastrically with anlotinib (3 mg/kg) daily for 12 or 15 days, and the control group was treated with double distilled H2O (dd H2O). (C) Tumor size was measured every 3 days, and tumor weight was measured at the end of the treatment. (D) Tumors were isolated and stained with TUNEL and DAPI. Representative images showed apoptotic cells. Scale bar: 100 μm. The TUNEL positivity (green) indicated apoptotic cells. (E) Quantification of TUNEL-positive cells. PDX, patient-derived xenograft; Ctr, control group; Anlo, anlotinib treatment group; MFI, mean fluorescence intensity. Data were shown as mean ± SD. Significance was determined by unpaired two-tailed Student’s t-test. *P < 0.05, **P < 0.01.

