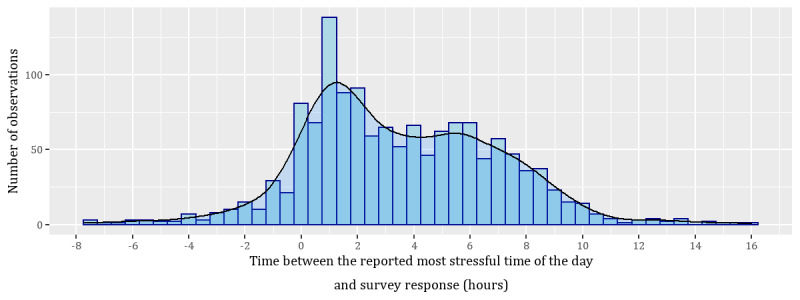
Figure 3.

Distribution of the time between the reported most stressful time of the day and the survey response time. Negative values are because of when participants anticipated that the most stressful time of the day would end after the survey response time. Positive times indicate that the most stressful time of the day started and ended before the survey was answered, and negative times indicate the most stressful time of the day at least ended after the survey was answered.
