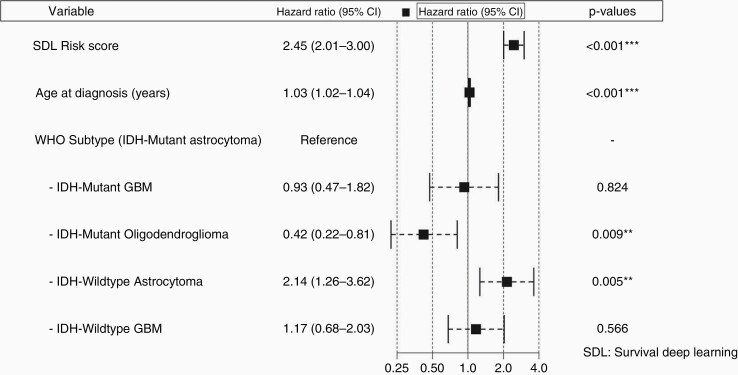
Figure 3.
Forest plot of the HRs for multivariate survival model. The figure illustrates the HR and 95% CI of the SDL risk score in the presence of other clinical variables, including age at diagnosis and WHO 2016 subtype. HR = 1: No effect; HR < 1: Reduction in risk; HR > 1: Increase in risk. HR, hazard ratio; SDL, survival deep learning.

