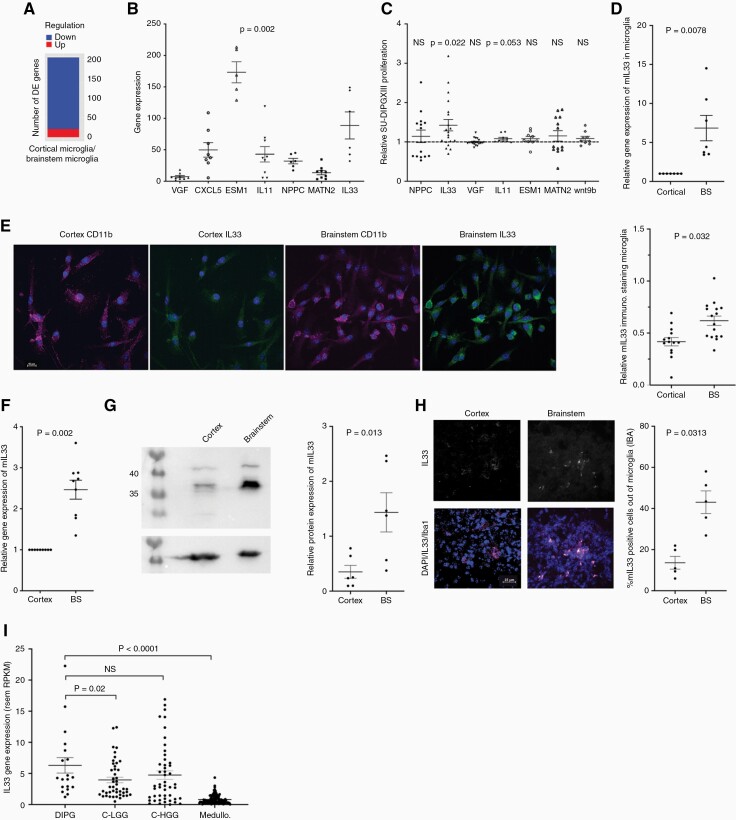
Figure 3.
Differential gene expression between brainstem and cortical microglia. (a) Global gene analysis of brainstem and cortical microglia using RNA-seq approach. Chart summarizing number of DEGs, where DEGs are genes that had abs{log2FoldChange} > 1 and padj < 0.05, after DESeq2analysis. Regulation was determined by the sign of log2FoldChange, wherelog2FoldChange > 0 indicated upregulation while log2FoldChange < 0 indicated downregulation in the first sample of each comparison. The comparison shown refers to gene expression change of cortical microglia on SU-DIPGXIII against brainstem microglia on SU-DIPGXIII. There are 21 upregulated and 185 downregulated genes in this comparison (n = 3 from each sample analyzed). (b) Quantitative PCR analysis was done on at least 6 separate SU-DIPGXIII + microglia co-culture trials, per gene tested. The values are expressed as the average fold change in brainstem co-cultures in comparison to the corresponding cortical co-cultures, ± SEM. (Wilcoxon’s signed-rank test; NPPC and IL33 n = 6; MATN2, VGF, IL11, and ESM1 n = 9, wnt9b n = 8. One tailed). (c) Screening of selected secreted factors, isolated from RNA-seq analysis, for positive proliferation effects on SU-DIPGXIII. Glioma cells were incubated with control medium or with a factor for 72 h, after which proliferation was measured using the CellTiter-Glo luminescence system. The data are presented as the average fold change of the secreted factor’s effect as compared to the control ± SEM. (Wilcoxon’s signed-rank test; NPPC, MATN2 n = 14, IL33, VGF n = 20, Epha3, Wnt9b, IL11, ESM1 n = 9. One-tailed, Bonferroni correction for multiple comparisons was applied). (d) Quantitative PCR analysis of mouse IL33 gene expression in pure microglial cell cultures. The values are expressed as the average fold change in brainstem cultures in comparison to the corresponding cortical cultures ± SEM. (Wilcoxon’s signed-rank test; n = 7). (e) Representative immunofluorescence for IL33 and CD11b on brainstem or cortical microglia (scale bar 10 μm). Analysis was performed with Nis-elements by measuring the ratio of mIL33-positive cells out of CD11b-positive cells. Quantification was done with the “sum area quantification” tool. (Fisher’s Combined Probability Test; n = 3.Within each trial, a Mann–Whitney U test was performed to obtain the p-values, n = 6 fields. One tailed). (f) Quantitative PCR analysis of mouse IL33 gene expression in the brainstem and cortex of P2 mice. The values are expressed as the average fold change in the brainstems in comparison to the corresponding cortexes, ± SEM. (Wilcoxon’s signed-rank test; n = 9). (g) A representative Western blot analysis of mIL33 expression in the brainstem and in the corresponding cortex of P2 mice. The graph shows a quantitative analysis of the Western blot trials, using GelQuant express, and then normalizing the mIL33 expression to the actin on the same membranes. At least 6 comparisons of brainstem-cortex were performed (Wilcoxon’s signed-rank test; n = 6). (h) Representative immunofluorescence for IL33 (white) and Iba1 (magenta) on a brain slice, from either the brainstem or the cortex. (scale bar 25 μm). Analysis was performed with Nis-elements by measuring the percent of mIL33-positive cells out of Iba1-positive cells. Quantification was done with the “sum area quantification” tool. (Wilcoxon’s signed-rank test; n = 5). (i) Human IL33 gene expression data obtained from PedcBioPortal. The gene’s expression within biopsies from DIPG samples was compared to cortical low- and high-grade gliomas and to medulloblastoma biopsies. Each point on the graph represents a single human sample. FPKM = fragments per kilobase of exon per million mapped fragments, RSEM = RNA-Seq by Expectation-Maximization (Mann–Whitney U test was performed).

