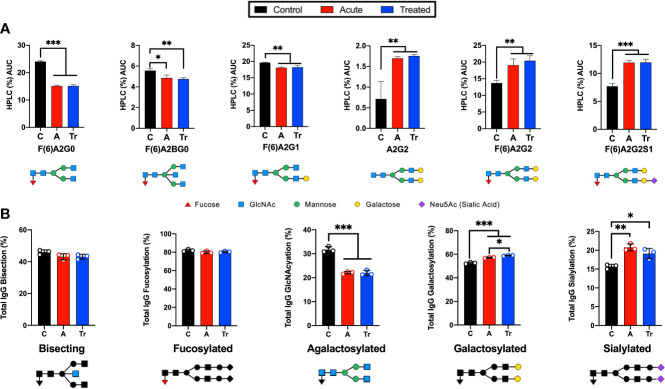
Figure 1.
Analysis of IgG reveals significant changes in N-glycan structure distribution during acute and treated LD. (A) Significant alterations of IgG N-glycans reported by HPLC analysis from pooled serum from control (C), acute (A), or treated (Tr) patients reported as the percent area under the curve (AUC) for each peak determined from the average of triplicate samples. N-glycan structures are displayed below. Control represents pooled healthy age-matched serum n=7, Acute represents pooled serum from two-tiered diagnosed Lyme disease patients n=5, Treated represents patients donating serum a second time 70-90 days after completion of the reportedly curative round of antibiotic treatment (14-21d doxycycline) for Lyme disease n=3. (B) Labeled N-glycan classes: Bisecting, Fucosylated, Agalactosylated, Galactosylated, Sialylated detected using HPLC analysis of IgG N-glycans from 3 replicates +/- S.D. Analysis was completed using One-Way ANOVA with post-hoc Tukey’s multiple comparisons, *p<0.05, **p<0.01, ***p<0.001.

