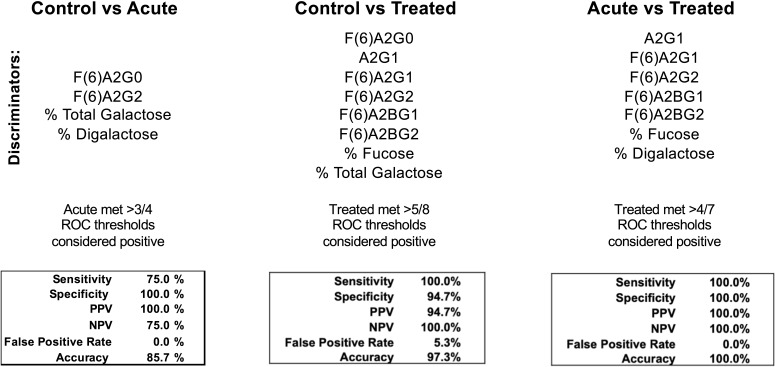
Figure 4.
Confusion matrices from combined discriminatory IgG N-glycan ROC thresholds. N-glycans with significant discrimination between cohorts determined using ROC analysis are listed above. The listed N-glycan discriminators were combined for each cohort comparison (Control vs Acute LD, Control vs Treated LD, Treated vs Acute LD) and the resulting confusion matrices are reported.

