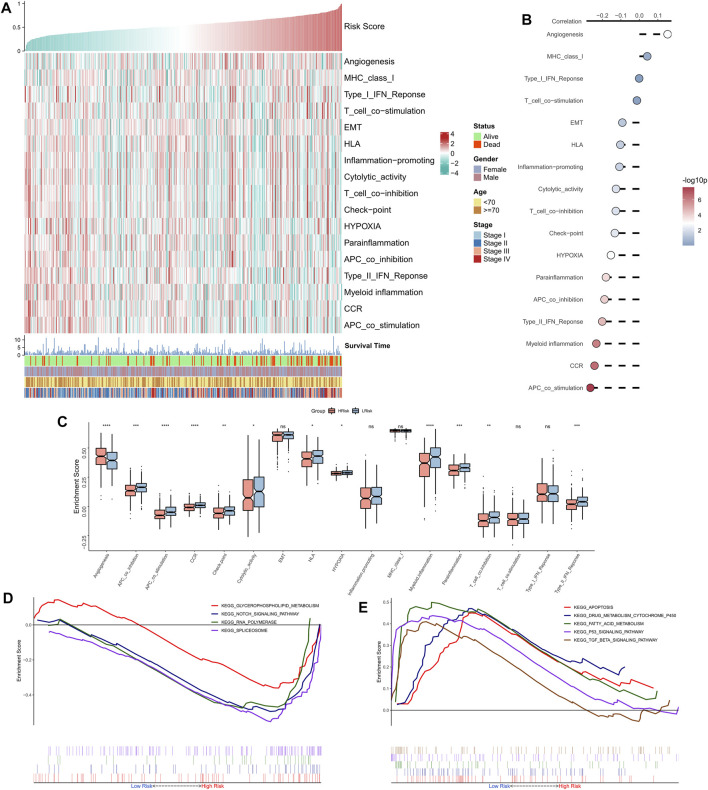
FIGURE 4.
Functional analysis of the NRG-related risk model. (A). Heat map showing the correlation between RiskScore, activities of biological pathways, and clinical characteristics; (B). Correlation analysis between RiskScore and biological pathways; (C). Box plots showing the differences in activities of the biological pathways between the high-risk and low-risk groups; (D). GSEA enrichment plot showing the four pathways of interest in the high-risk group; (E). GSEA enrichment plot showing the 5 pathways of interest in the low-risk group.

